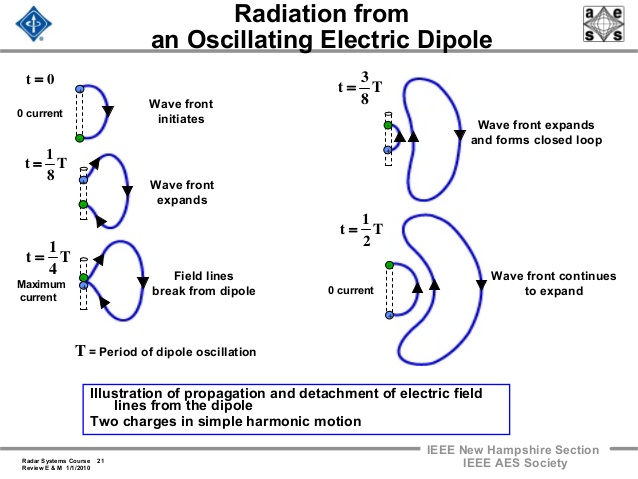
Visualising what happens is difficult because you have to do this in three dimensions whilst also considering a sequence of events occurring as time passes.
Here is a gif image which illustrates the electric field moving out from a dipole shown in blue in the centre.
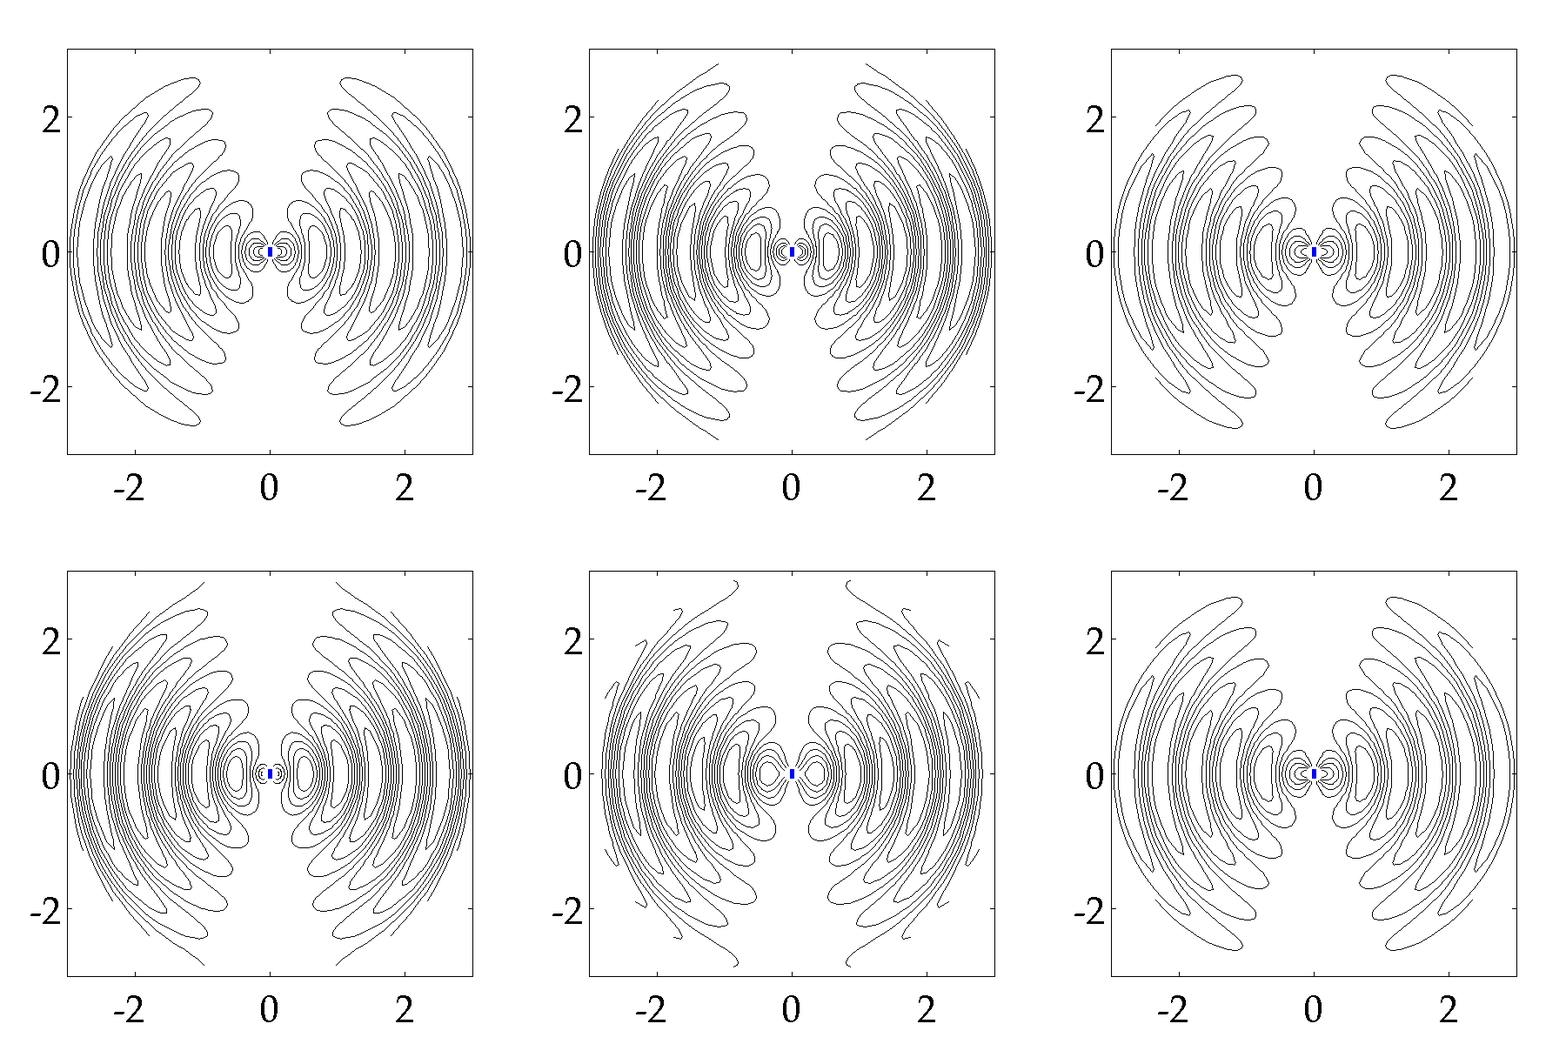
The advantage of this image is that you get the idea of the electric field lines moving out but also an idea that there are regions were the magnitude of the electric field (E-field) is high (lines close together) and regions where the electric field is zero (in the centre of the loops).
So if you are in position "$0$" left what you would detect is a varying electric field strength and I will show you later that the electric field would reverse.
So perhaps you can imagine a sinusoidally varying electric field radiating out in all directions but with a magnitude which is greatest to the left and right or better still along a plane which is orthogonal to the axis of the dipole - the dipole is directional.
Note there is no radiation upwards and downwards in the image.
I have annotated your diagram.
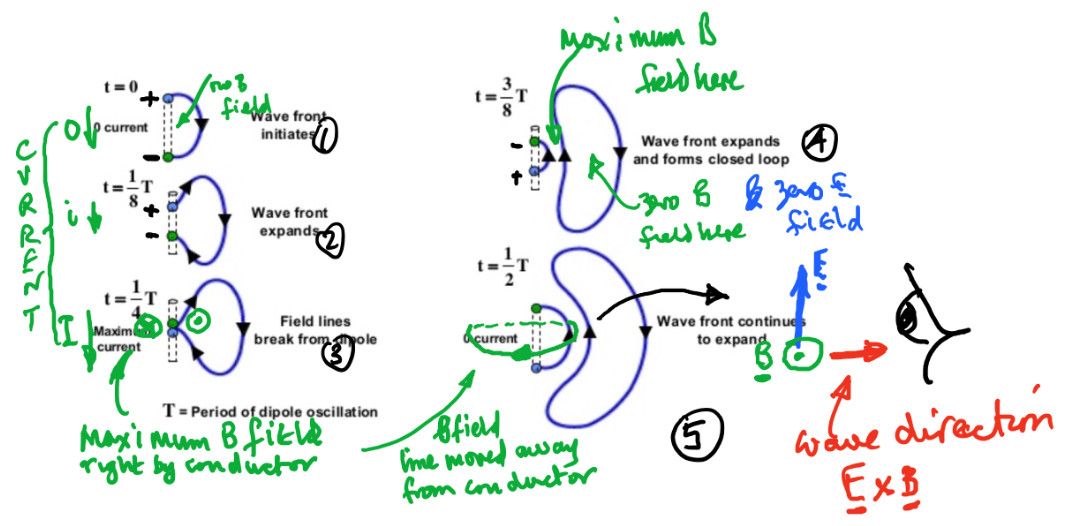
The magnetic field which is produced is as that produced by a wire - concentric circles - but in this case the current is changing so the strength of the magnetic field (B-field) is changing and you must also remember that the B-field is also moving out just like the E-field.
When the current is largest (diagram 3) the magnitude of the B-field is largest and this coincides with the times that the magnitude of the E-field is a maximum.
So the E-field and the B-field are in phase with one another.
The fields are also zero at the same time.
In diagram 5 I have put in a magnetic field line which would actually be a circle if I could draw the diagram in three dimensions.
An important thing to note is that the E-field and the B-field are at right angles to one another and that $\vec E \times \vec B$ gives the direction in which the electromagnetic wave is travelling.
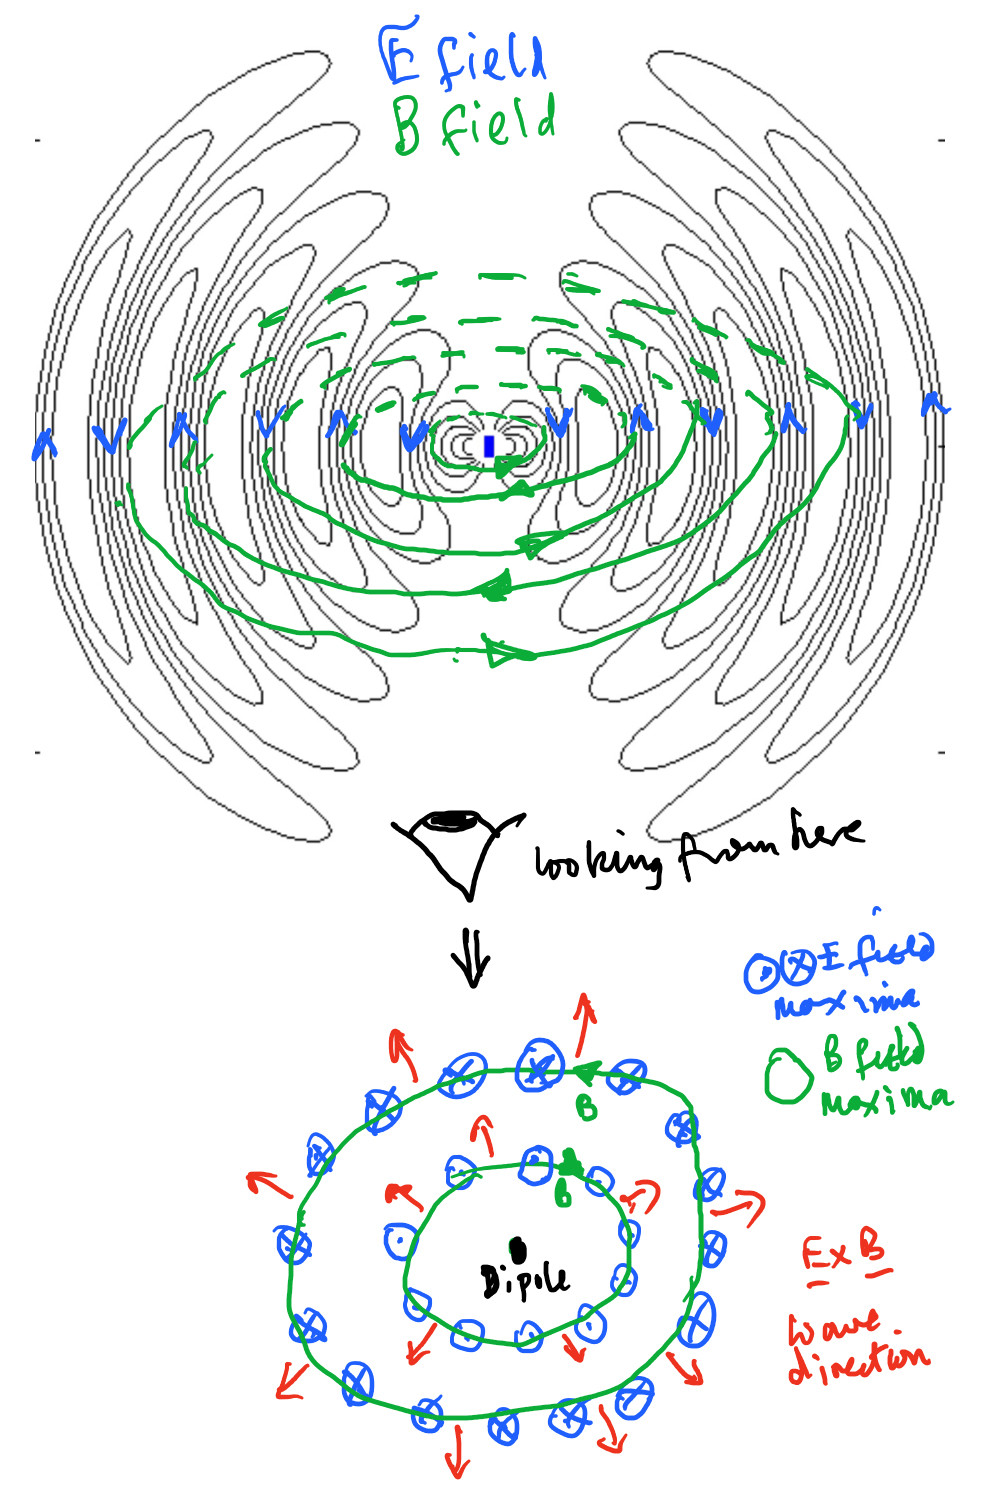
To continue I have to move away from your diagram and go to an annotated diagram obtained with the help of the gif file.
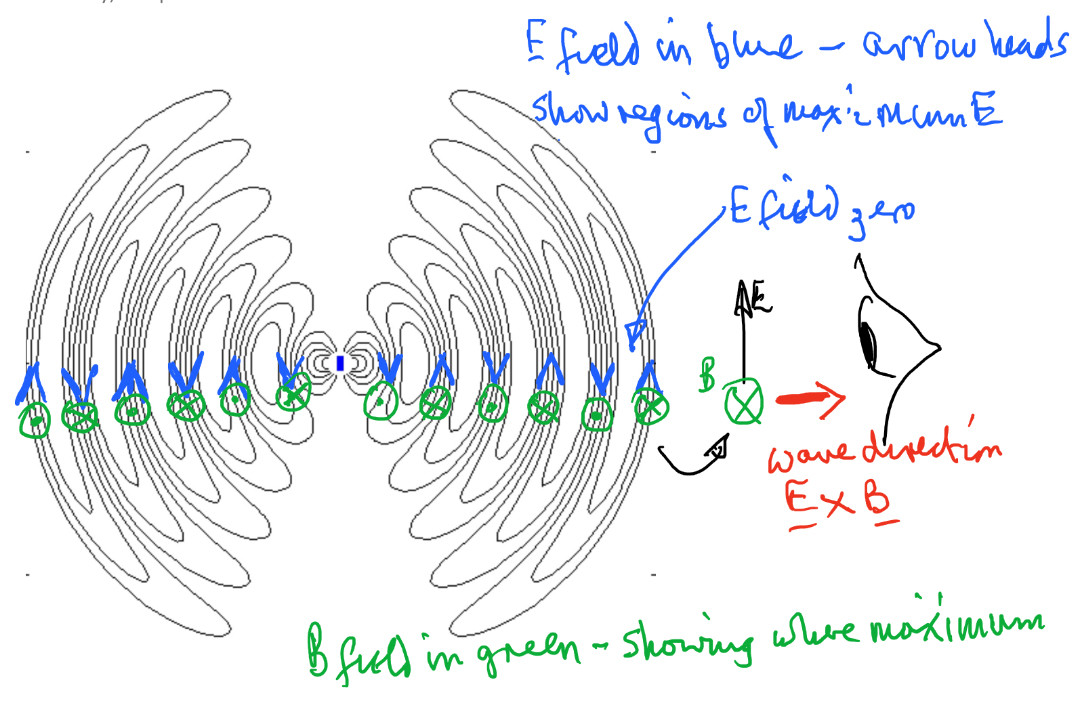
The black lines are the E-field lines and I have added arrowheads to them to show that the direction of the E-field varies every half a period.
There are also added $\odot$ and $\otimes$ symbols in green to show the directions of the B-field coming out and going into the screen at positions when the B-field is largest.
Note how the E and B fields reverse direction every half a period.
Again $\vec E \times \vec B$ gives the direction of wave motion.
So what the eye sees is an oscillating E-field in the plane of the screen and an oscillating B-field in phase with the E-field by oscillating in and out of the screen.
The final diagram is there to try and show the three dimensional nature of the radiation emitted by a dipole with the diagram at the bottom showing the E and B fields in a plane passing through the centre of the dipole and orthogonal to the axis of the dipole.
