3
$\begingroup$

Charts of particle flux tend to show the flux rate in units of particles per metre squared per second per steradian per MeV. I don't understand what the "per MeV" is referring to. How do I convert particle flux units per MeV into particle flux units (without the MeV part)?

In Figure 1 in this paper, in the middle of the chart near the top it has an arrow pointing to a data point, and by the arrow it says "1 particle per m^2-second". If I chose another data point on the chart, what steps would I need to follow to calculate a similar result for it, in terms of the number of particles per metre squared per second which it represented?

$\endgroup$
2
  • $\begingroup$ In the linked paper, which number figure are you referring to? $\endgroup$
    – Mark H
    Commented Nov 5, 2020 at 23:42
  • $\begingroup$ Sorry, I was referring to Figure 1. $\endgroup$ Commented Nov 6, 2020 at 8:43

2 Answers 2

5
$\begingroup$

The "per MeV" refers to the fact that the flux rate $f(\theta,\phi,E)$ tells you the particle flux per unit solid angle per unit energy. That is, $f(\theta,\phi,E)\ d\Omega \ dE$ is the particle flux (in particles per unit area per second) within a small solid angle $d\Omega$ around $(\theta,\phi)$ and a small energy range $dE$ around $E$.

If you want to find the particle flux per unit solid angle (without the energy part), then you need to integrate over all energies in some range, i.e.

$$\hat f(\theta,\phi) = \int_{E_1}^{E_2} f(\theta,\phi,E)dE$$

which is the flux of particles per unit steradian with energy between $E_1$ and $E_2$. It's worth noting that when you have a histogram with energy bins $\Delta E_i$, then the quantity being plotted is $f(\theta,\phi,E_i)\Delta E_i$.

To obtain $f(\theta,\phi,E)$ from a histogram, you divide the counts in each bin by the bin width. Conversely, if you have the so-called differential flux $f(\theta,\phi,E)$ and want to know how many counts to expect in a histogram bin at some energy, you simply multiply it by the bin width.


The figure in question is this one:
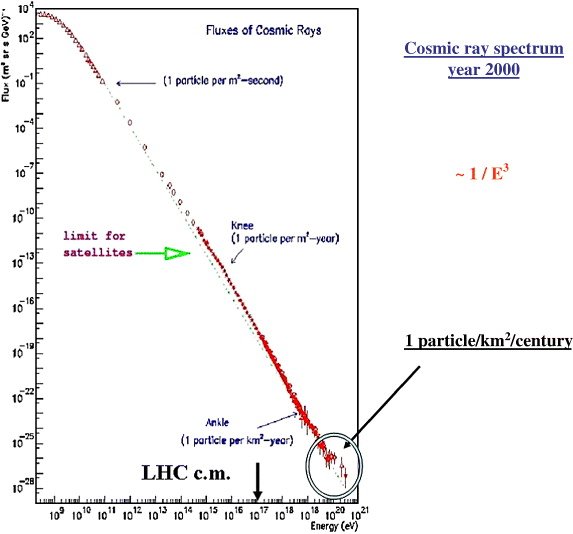
enter image description here

Source

The point marked "1 particle per m$^2$-second" has $f(\theta,\phi,E)\approx 10^{-1}$ m$^{-2}$ s$^{-1}$ sr$^{-1}$ GeV$^{-1}$. If we multiply by $4\pi$ (assuming the flux is isotropic) and a bin width of $1$ GeV, then we get the right flux.

Apparently at $10^{11}$ eV, the bin sizes are approximately $1$ GeV. The logarithmic scale suggests logarithmic binning, so at $10^{16}$ eV we would expect a bin size of about $10^5$ GeV. The plot indicates that $f(\theta,\phi,10^{16}\text{ eV}) \approx 10^{-14}$ m$^{-2}$ s$^{-1}$ sr$^{-1}$ GeV$^{-1}$, so multiplying by $4\pi$ and $10^5$ GeV yields a flux of $0.4$ particles per square meter per year, which is the right order of magnitude for the second label.

As far as interpretations go, you should take the first label as saying that about 1 particle with energy within $1$ GeV of $10^{11}$ eV passes through a 1 m$^2$ target every second. The second label tells you that about 1 particle with energy within $10^5$ GeV of $10^{16}$ eV passes through a $1$ m$^2$ target every year.

An alternative way to say it is that one particle with energy within $1\%$ of $10^{11}$ eV passes through a $1$ m$^2$ target every second, while one particle with energy within $1\%$ of $10^{16}$ eV passes through a $1$ m$^2$ target every year.

$\endgroup$
2
  • $\begingroup$ So one would need to have the data to do this? $\endgroup$ Commented Nov 6, 2020 at 22:09
  • $\begingroup$ @N.Steinle I've updated my answer with more detail about the OP's specific question $\endgroup$
    – J. Murray
    Commented Nov 6, 2020 at 22:55
1
$\begingroup$

EDIT: I was mistaken, it appears to not be an arbitrary scaling but rather an inherent part of the representation of the data. Possible duplicate of: Why do we plot distributions (histograms, etc) per logarithmic interval (i.e. per "dec"/"dex")? and/or Units used in X-ray energy spectrums

So, I think the key part from rob's answer is

$$ \frac{dN}{dE\cdot dA \cdot dt\cdot dI} $$

You're not bothered by the fact that if you ran the experiment twice as long, or used a detector with twice the area, or drove twice as much current through the source, that you'd double the number of photons you find. For energy the relationship is nonlinear: the total number of events is N=∫dNdEdE, and what's plotted here is the differential dN/dE.

Another way to say it is according to @dmckee --- ex-moderator kitten that you have to normalize the bins of the y-axis to those of the x-axis to account for the different binning between them.

I think this means you'd need the data itself in order to represent the data for a different dE. However, I could be mistaken about this and maybe someone more experienced can provide a better answer.

[old part:]

The "per MeV" means divided by one mega-electron volt which is MeV = $10^6$ eV.

The first few figures of the paper you provided are all particle fluxes with similarly expressed units. Ultimately, whether you want to express them in terms of MeV or GeV = $10^9$ eV is a matter of the data that is being plotted, since it is just a scaling. For instance, if I had data of the mass of various stars as a function of their ages, then I can choose to scale the mass units by whatever is relevant for the regime I'm working in: earth masses, jupiter masses, solar masses (which is typical in astrophysics), etc...

So, unless I've misunderstood your question, that energy is just a scaling for the plots. Similar to how figure 9 of that paper is scaled by $10^{-24}$.

I'm not sure what you mean when you say "How do I convert particle flux units per MeV into particle flux units (without the MeV part)?" This is pretty customary, for example see here. Perhaps you can refine your question?

$\endgroup$
7
  • $\begingroup$ Probably he wants to integrate over all energies to get a some sort of total flux? (I didn't read the paper, so I'm guessing from just the question and your answer.) $\endgroup$
    – Brick
    Commented Nov 5, 2020 at 23:15
  • $\begingroup$ @Brick That's a good point and is also possible! $\endgroup$ Commented Nov 5, 2020 at 23:17
  • 1
    $\begingroup$ This answer may also be relevant. $\endgroup$
    – Mark H
    Commented Nov 6, 2020 at 4:44
  • $\begingroup$ Thanks, I think that's all I wanted to know. So it just means, before they plot every point on the y-axis, they literally divide the value by 10^6? Is that how you "divide by an MeV"? So if I multiply every value by 10^6, I'll find the number of particles per m^2/s/st? $\endgroup$ Commented Nov 6, 2020 at 8:39
  • $\begingroup$ I have rewritten the second paragraph of my question to make it clearer what I am asking. Many thanks. $\endgroup$ Commented Nov 6, 2020 at 16:12

Your Answer

By clicking “Post Your Answer”, you agree to our terms of service and acknowledge you have read our privacy policy.

Not the answer you're looking for? Browse other questions tagged or ask your own question.