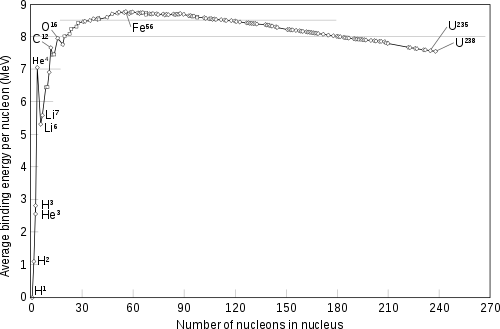
The nuclear binding energy curve is often presented as a reason why iron is abundant in planet cores. However, to me it is not entirely evident why binding energy per nucleon, E/A, is chosen to assess the possibility of a nuclear reaction. Alpha decay is a counterexample where the E/A value results in ambiguity. One of the two decay products, the alpha particle, has a smaller E/A. So in general E/A is not a suitable predictor. For simple decay, ΔE = Emother-Edaughter is better than E/A.
-
2$\begingroup$ Can you clarify what you mean by "appropriate" and "the best parameter"? Are you asking when the binding energy per nucleon is a good indicator of whether or not a nucleus will decay? $\endgroup$– J. MurrayCommented Apr 24, 2019 at 13:16
-
$\begingroup$ By "appropriate" and "the best parameter" I mean that the (E/A)-A graph is apparently preferred in physics books, for unspecified reasons. My question is why it is preferred over the E-A graph. It seems to me that nuclear reactions depend on the total energy, not specifically on the energy per nucleon. Maybe it is just for graphical reasons? $\endgroup$– jkienCommented Apr 24, 2019 at 14:18
-
$\begingroup$ Preferred for what? Based on the wording of your question I assume you're interested judging the stability of a nucleus, is that right? $\endgroup$– J. MurrayCommented Apr 24, 2019 at 14:20
-
$\begingroup$ @jkien The stability of a nucleus against things like fusion and fission is related more to its binding energy per nucleon than the total binding energy. $\endgroup$– probably_someoneCommented Apr 24, 2019 at 14:29
-
1$\begingroup$ @jkien: When people ask for clarification on a question, it's best to provide that clarification by editing the question rather than by replying in comments. $\endgroup$– user4552Commented Apr 24, 2019 at 15:00
1 Answer
The BE/A curve presents a visual qualitative average behavior for how tightly bound a nucleus of a given A might be. A-values which are lower on the BE/A axis have more mass energy per nucleon so that it's possible to move them, through some reaction, to a higher point and have a net gain of kinetic or radiative energy.
Alpha decay is a process which moves heavy nuclides to a lower A and generally higher BE/A value. Beta decays don't change A, so, due to the average qualitative nature or the curve, BE/A doesn't mean much.
Two main types of reactions which reflect the nature of the curve are fission of large A nuclides and fusion of small A nuclides. If fission of a large A (>234) nuclide can be induced (or if it happens spontaneously), the result will usually be two large fragments centered roughly around 2/5A (~94) and 3/5A (~140). Looking at the BE/A curve one will see that the BE/A values at those smaller nucleon counts are higher, indicating less mass energy in the system, and hence more kinetic or EM energy.
Fusion of light nuclides (A=1, 2, or 3), require the input of large kinetic energies, aided by QM tunneling usually, to create nuclides of A=4, 5, or 6, but the very large changes in the BE/A curve at the low A end of the curve results in a net output of energy. A=4 or A=12 can be fused in the extreme conditions of hot stars to move even further up the BE/A curve.
-
$\begingroup$ Ok, so the graph is meant for fission, where it is silently assumed that the fragments are heavier than iron, and for fusion, where it is assumed that the fusion product is lighter than iron. $\endgroup$– jkienCommented Apr 24, 2019 at 20:15
-
1$\begingroup$ @jkien It's not "meant" for those things in particular. It is "meant" to show the general relationship of binding and mass. It can be used to justify the general behaviors of light mass fusion and heavy mass fission. It can also be used to explain stellar energy limits. And there is no "silent" assumption. Technically, anything above the vertical axis starting point could be a product from an energy point of view. There may be other factors that influence the actual products. $\endgroup$– Bill NCommented Apr 24, 2019 at 20:23
