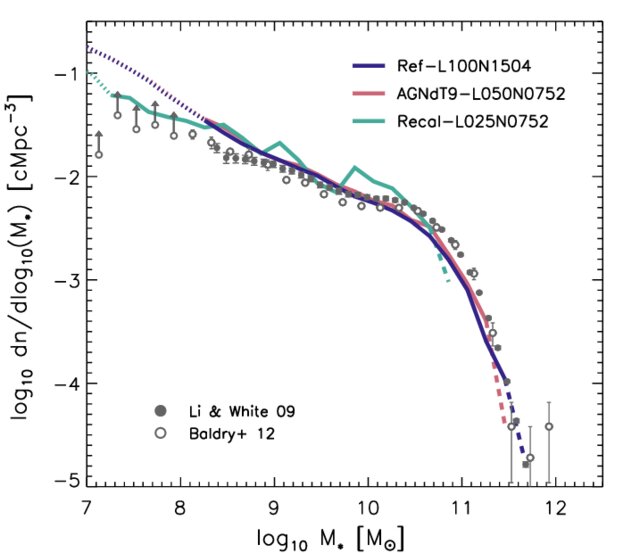
The concept you're looking for is the galaxy mass function. I'll just point out how to interpret one example. This is a "stellar mass function", so it's showing the distribution of galaxies by how much mass they have in stars only. It comes from a simulation paper; the curves show simulation data while the points show observational data.

$M_*$ refers to a galaxy's mass in stars ("stellar mass"), given in units of $\mathrm{M}_\odot$ (mass of the sun). $n$ refers to the number density of galaxies, i.e. the number of galaxies per spatial volume. It is given in inverse cubic comoving megaparsec ($\mathrm{cMpc}^{-3}$). The quantity
$$\mathrm{d}n/\mathrm{d}\log_{10}M_*$$
is then the differential number density of galaxies, per logarithmic interval in stellar mass. For example, since $\mathrm{d}n/\mathrm{d}\log_{10}M_*\simeq 10^{-2.2}$ at $M_*\simeq 10^{9.5}~\mathrm{M}_\odot$, that means there are about $10^{-2.2}$ galaxies per $\mathrm{cMpc}^{3}$ that have stellar masses in the range $10^{9}~\mathrm{M}_\odot$ to $10^{10}~\mathrm{M}_\odot$.

