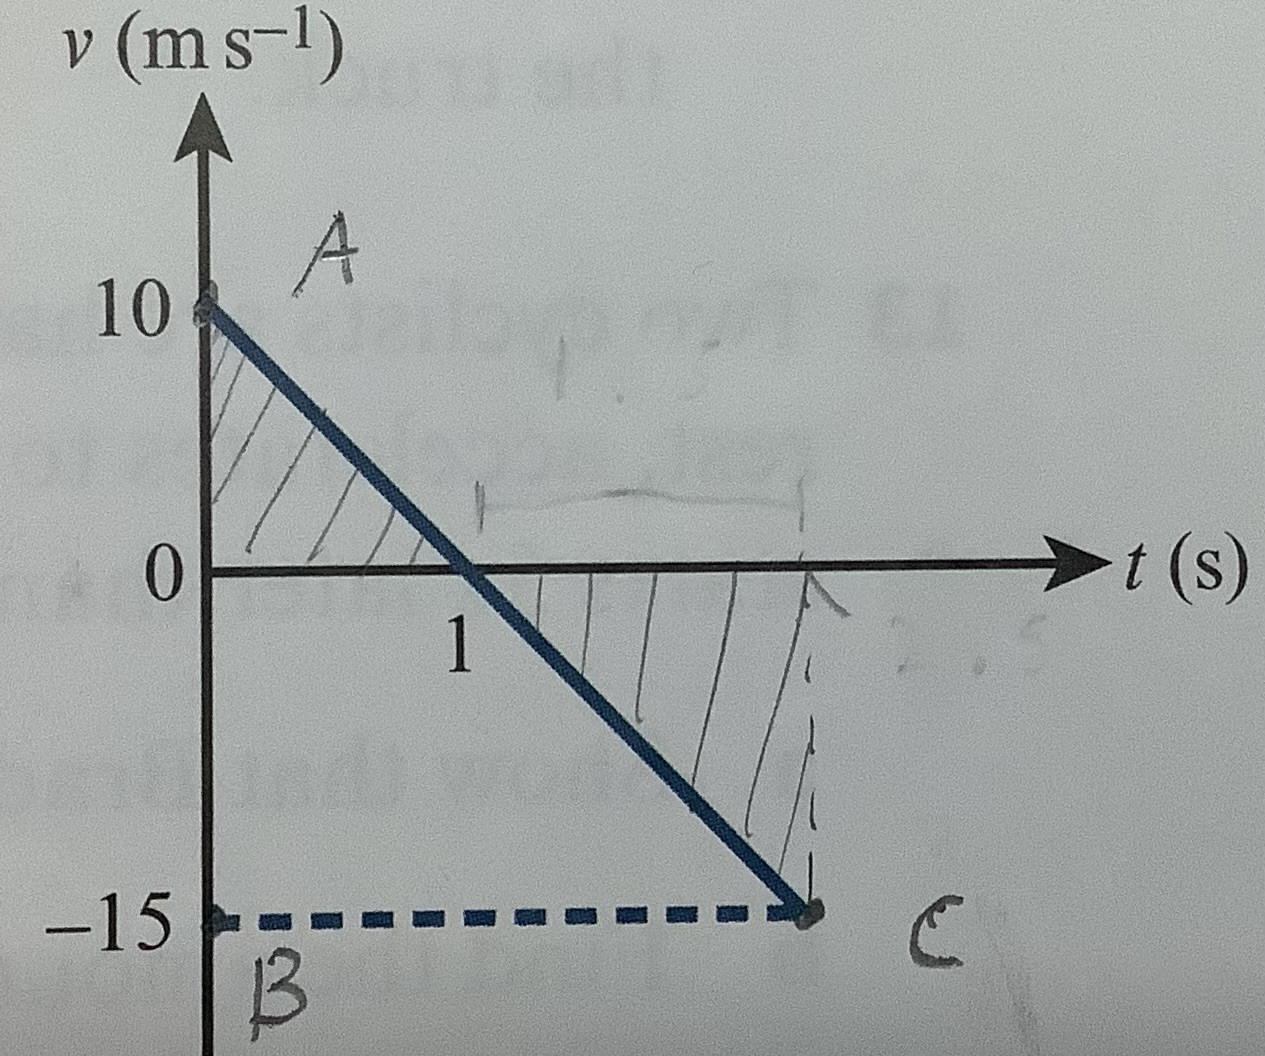
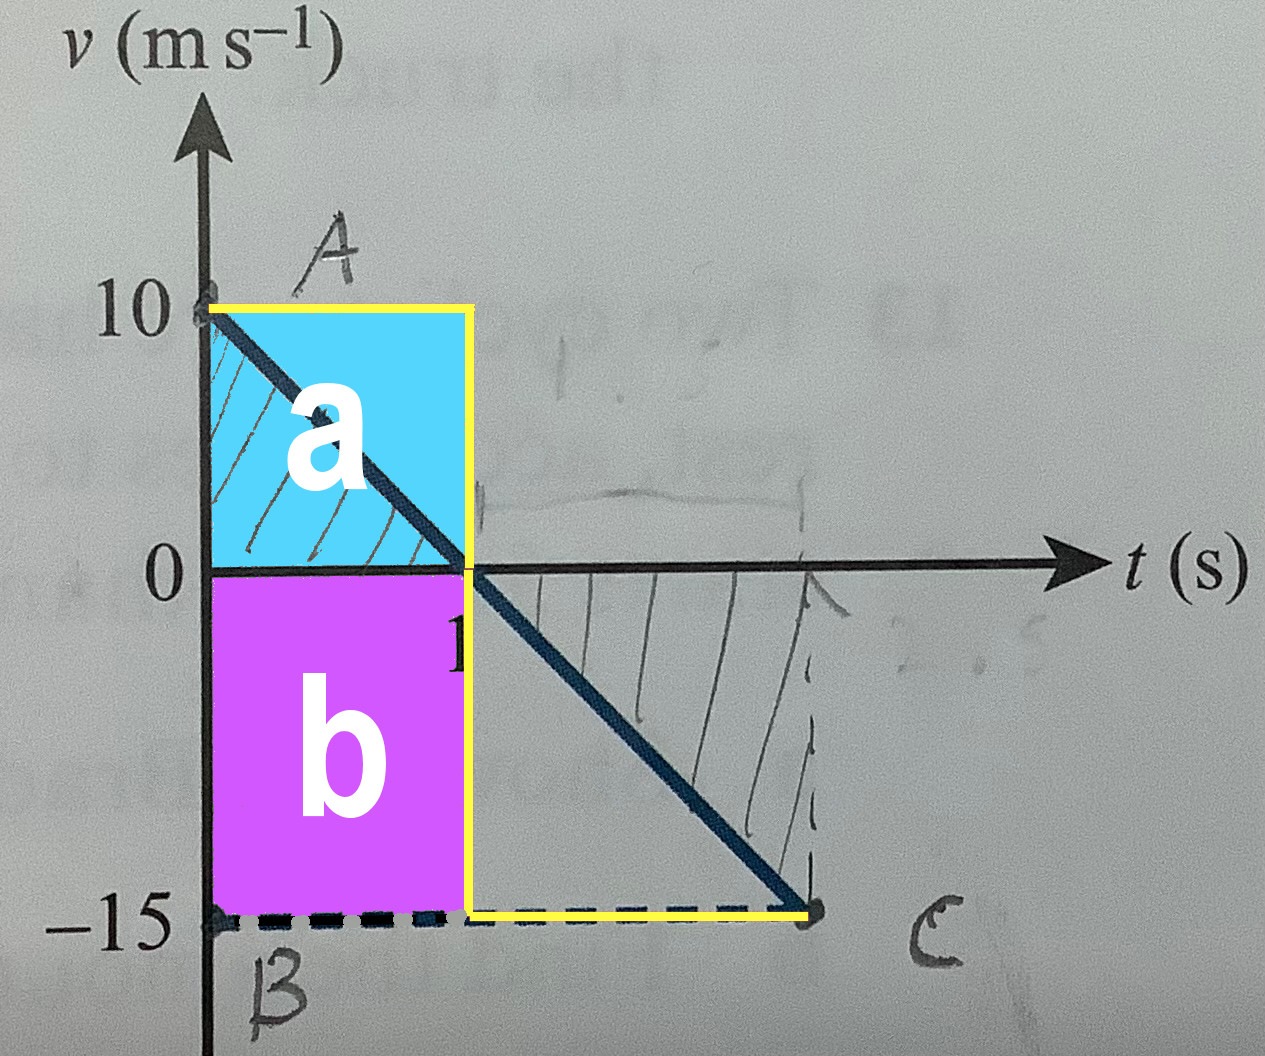
The "$v$-axis", as you call it, is really just the line where $v=0$.
For parts of a $v$-vs-$t$ curve where $v=0$, the object isn't moving - so nothing to add to the net displacement.
When $v(t)$ starts to go slightly over $v=0$, the object starts moving slowly upwards (I'm assuming the 'positive' direction is plotted going upwards, which is usually the case for $x$-vs-$t$ graphs). So the teeny bit of area between the curve and the $v$-axis is what contributes to the net displacement.
As $v(t)$ gets further away from $v=0$, the object is moving faster, and there's a much larger area to add.
Same goes for $v(t)$ below the $v$-axis, except the object is moving in the opposite direction, so you have to subtract it instead of adding it.
To get the total displacement, you need to add all the upward movement (area above $v=0$) and subtract all the downward movement (area below $v=0$).


