Any visualization is going to be incomplete, because $e^{i(\vec k \cdot \vec r - \omega t)}$ defines a complex-valued field at every point in a four-dimensional spacetime. We have to simplify.
Two simplifications we can make are to choose a specific time, such as $t=0$ (which we can relax later by animating our visualization), and to choose a coordinate system in which $\vec k = |k| \hat z$ is parallel to one of our major coordinate axes. Now we have the simpler task of visualizing the complex field $e^{ikz}$ in one dimension only.
Let’s visualize this complex field in one dimension by attaching a visualization of the complex plane to every point along the $z$-axis. At $z=0$ the wave $e^0=1$ is purely real. At all values $z$ the wave $e^{ikz}$ has unit magnitude. The value $1+0i$ recurs whenever the argument $kz$ is an integer multiple of the circle constant $2\pi$ (“one turn”). Purely real or purely imaginary values of the field occur when $kz$ crosses each quarter-turn, in the pattern $1, i, -1, -i, \cdots$. The complex value varies continuously between these specific values as $kz$ varies.
An appealing way to visualize this would be use the ordinary $x,y,z$ axes, interpreted in the following way: the $z$-axis tells us the location in space where we are sampling the field, the $x$-axis tells us the real part of the value of the field, and the $y$-axis tells us the imaginary part of the value of the field. In this visualization it would be natural to draw a corkscrew around the $z$-axis, passing through the points
| $z$ |
$x,y$ |
| $0$ |
$1,0$ |
| $\frac18\frac{2\pi}{k}$ |
$\frac1{\sqrt2},\frac1{\sqrt2}$ |
| $\frac14\frac{2\pi}k$ |
$0,1$ |
| $\vdots$ |
$\vdots$ |
But that corkscrew is a misleading visualization, because we have the $x$- and $y$-axes doing double duty. The wave $e^{i(\vec k \cdot \vec r - \omega t)}$ is defined everywhere in spacetime: we can compute the real part and imaginary part of the field for every value of $(x,y,z,t)$. So we actually need the much larger table
| $x,y$ |
$z$ |
$\Re\ e^{i\vec k \cdot \vec r}$ |
$\Im\ e^{i\vec k \cdot \vec r}$ |
| $0,0$ |
$0$ |
$1$ |
$0$ |
| $0,1$ |
$0$ |
$1$ |
$0$ |
| $-1,1$ |
$0$ |
$1$ |
$0$ |
| (anything else) |
$0$ |
$1$ |
$0$ |
| $\vdots$ |
$\vdots$ |
|
|
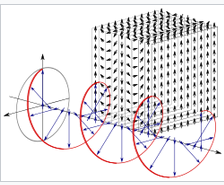
That’s what’s happening in the second visualization in your question:

Here we seem to have the $\vec k$-direction coming out of the screen and to the right, and the complex value of the field represented in a plane perpendicular to $\vec k$ with the real axis pointing upward. But we also have a volume-filling array of little arrows in little complex planes emphasizing that this complex field is defined at every point in space.
As $t$ increases, the shape of your visualization will translate in the $\vec k$-direction with speed $v = \omega/k$.
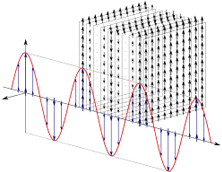
It’s worth pointing out that your fourth illustration,

if we use the same convention, represents a field like $e^{i\vec k \cdot \vec r} + e^{-i\vec k \cdot \vec r} = 2\cos\vec k \cdot \vec r$ which is defined at every point in space but whose value can be represented by a real number rather than a complex number.
These visualizations get hairier when you use them in electromagnetism, where the value of the field is two three-dimensional vectors $\vec E, \vec B$ everywhere in space, rather than just a complex number. Further complicating the issue, there are symmetries required between $\vec E$, $\vec B$, and $\vec E\times\vec B$ in discussions of electromagnetic waves and their polarization states, which just so happen to invite a geometrical interpretation similar to the corkscrew-everywhere illustration. You have to read carefully to know what you are getting.


