The first problem you might have with the wave equation is to visualise the graph.
This is because the displacement of a particle in the medium through which the wave is travelling $y$ depends on both position $x$ and time $t$.
So you need to draw a 2D graph on a 2D computer screen and then this not even take care of a 3d wave with position $(x,y,z)$ and time $t$.

Two ways which are used to describe a wave is to keep one of $x$ and $t$ and draw the appropriate graph(s) of $y$ against $t$ at a fixed position $x$ or $y$ against $x$ at a fixed time $t$, equivalent to taking a photograph of the wave.
Now looking at your equation but making life easier by setting $\phi = 0$ you have
$y(x=0) = A \sin (\omega t)$ at x = 0 and $y(x=a) = A \sin (\omega t + ka) at x = a$.
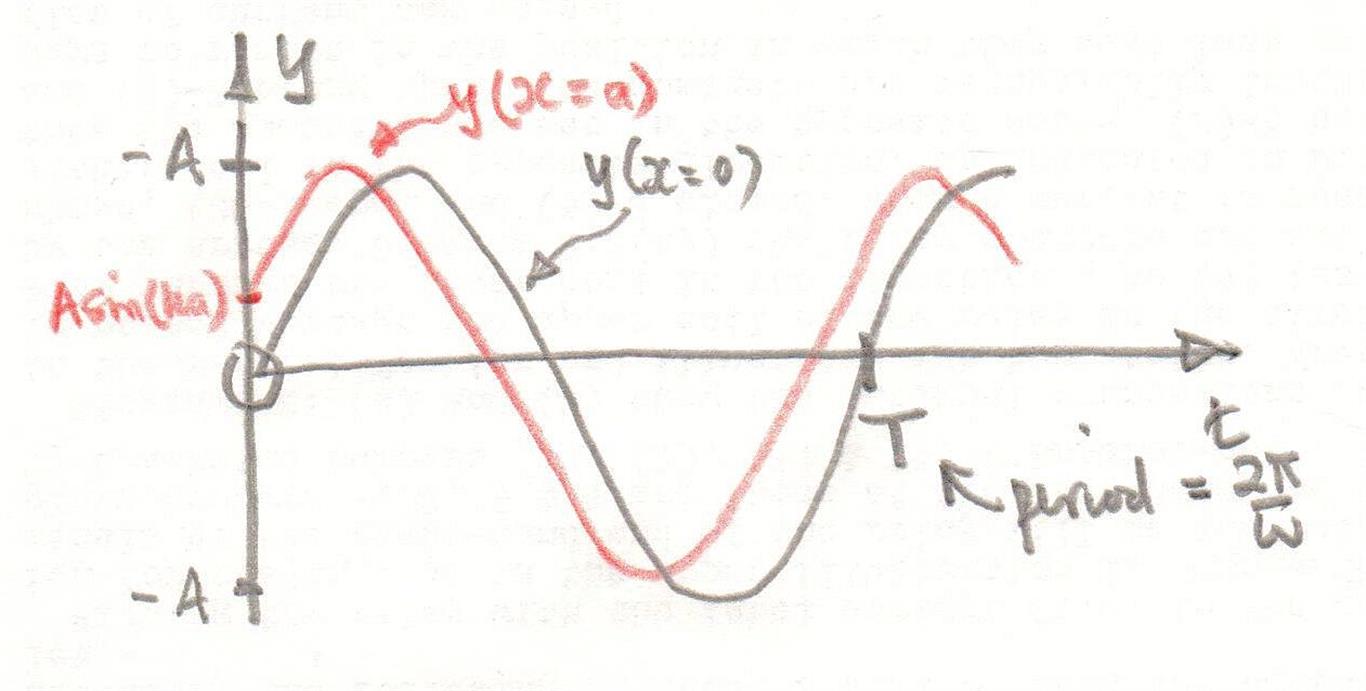
Drawing these graphs out you get the following:

Now what do these graphs tell you about the motions of the particles at $x=0$ and $x=a$?
The simplest interpretation is that whatever the particle at $x=a$ does the particle at $x=0$ does a little later in time. So the motion of the particle at $x=0$ lags behind that of the particle at $x =a$.
A word of caution here. Just glancing at those two graphs you might think that the $x=0$ graph is leading the $x=a$ graph. But this is not a graph of $y$ against position $x$ it is a graph of $y$ against time $t$ and going towards the right means later in time.
Given that it takes time for information/energy to travel from one place to another this shows that the wave must be travelling in the negative x-direction. This is often called a left travelling wave.
If you changed the plus sign in the bracket to a minus sign ie $(\omega t – kx)$ you should be able to convince yourself that you have a wave travelling in the positive x-direction which is called a right travelling wave.
Suppose that now you look at the motion of the particles further away from the particle at $x=0$.
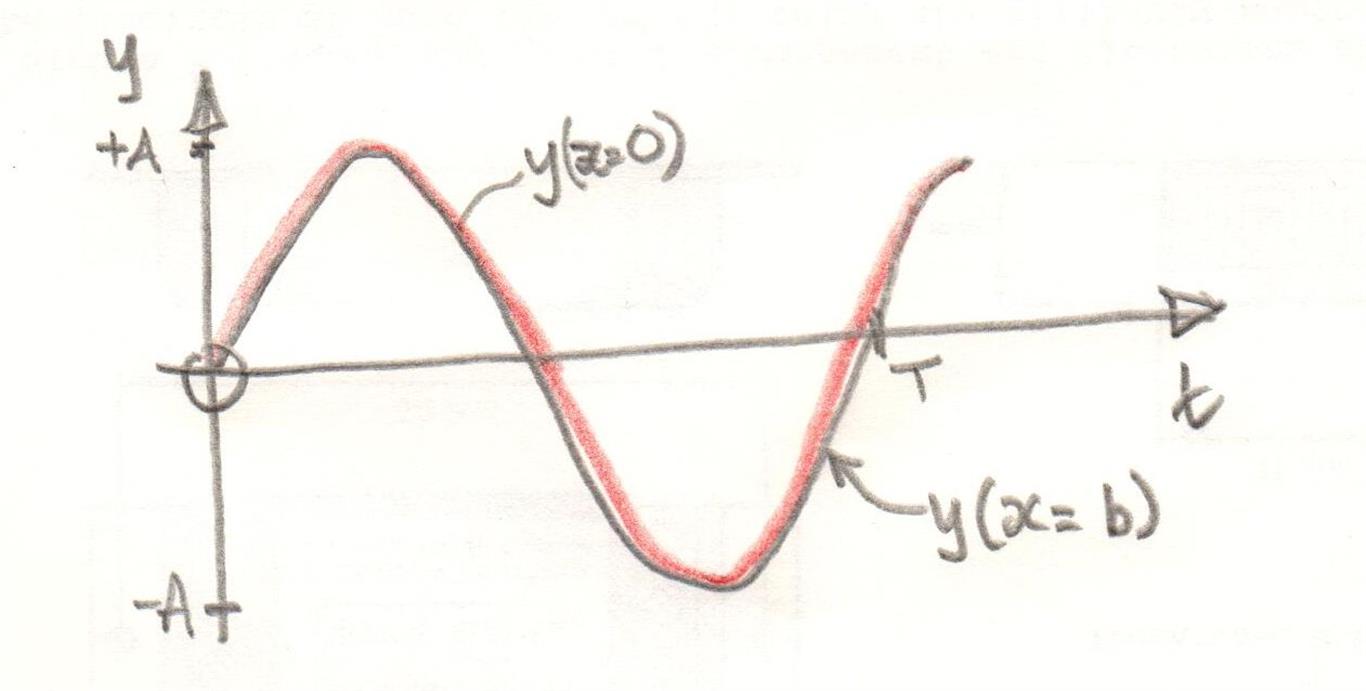
The separation in time of the two graphs will increase and increase until a position is reached where a particle at $x=b$ has a motion exactly the same as the one at x=0.

The the motion of the particle at $x=b$ is exactly one oscillation/cycle in advance of the particle at $x=0$.
So now we have that
$y(x=0) = y(x=b)$ or $A \sin(\omega t) = A\sin(\omega t + kb)$.
For this to be true $kb = n 2\pi$ where $n$ is an integer.
The simplest case is for $n=1$ and we give this distance $b$ a special name – wavelength and the symbol lambda $\lambda$
So $k \lambda = 2 \pi \Rightarrow k = \dfrac {2 \pi}{\lambda}$.
So the parameter $k$ is related to the wavelength of a wave and is used to compare the phases of particles' displacements in the medium at various positions.
A similar analysis can be done by drawing graphs of $y$ against $x$ to show that $\omega = 2 \pi f= \dfrac {2 \pi}{T}$ where $f$ is the frequency of the wave and $T$ its period.
The parameter $\omega$ is used to compare the phases of particles' displacements in the medium at various times.
Added later in response to a comment
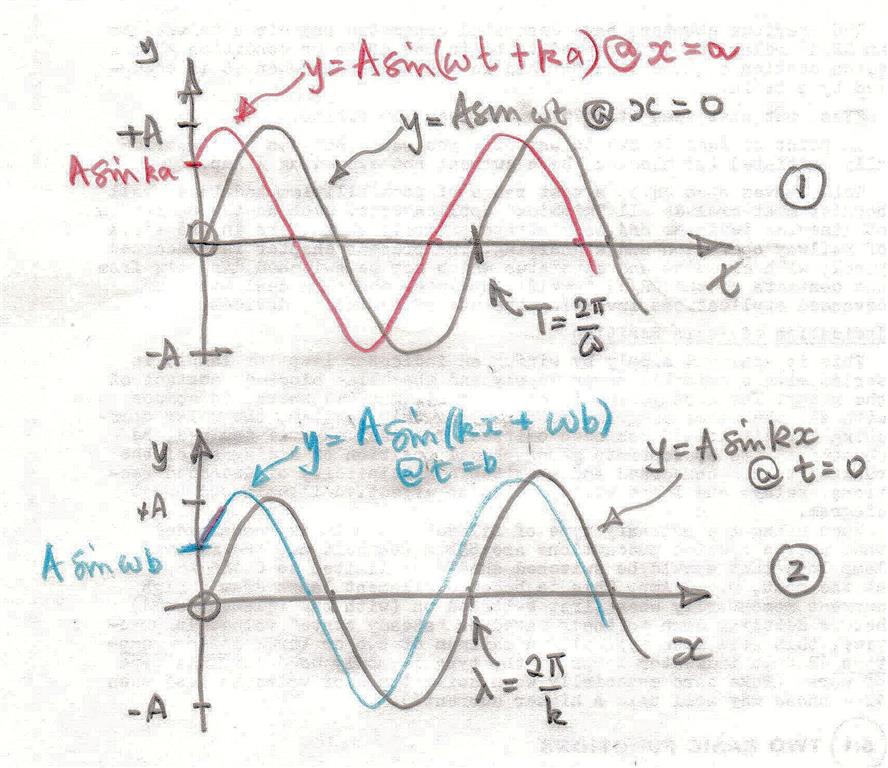
Below I have drawn two graphs which are often reproduced in connection with waves and the wave equation.
I have done that to show that they look very similar and yet are totally different.

Graph 1 is a graph of the displacement of a particle $y$ against time $t$ for two particles one at $x=0$ and the other at $x=a$.
Graph 2 is a graph of the displacement of the particle $y$ at a position $x$ from the origin at time $t = 0$ and time $t = b$. This is sometimes called a wave profile and is that you would get if you took photographs of the wave at two different times.
It should be clear from this graph that the wave is still travelling to the left as predicted above.
The graphs are presented this way because the displacement $y$ depends both on position from the origin $x$ and time $t$.


