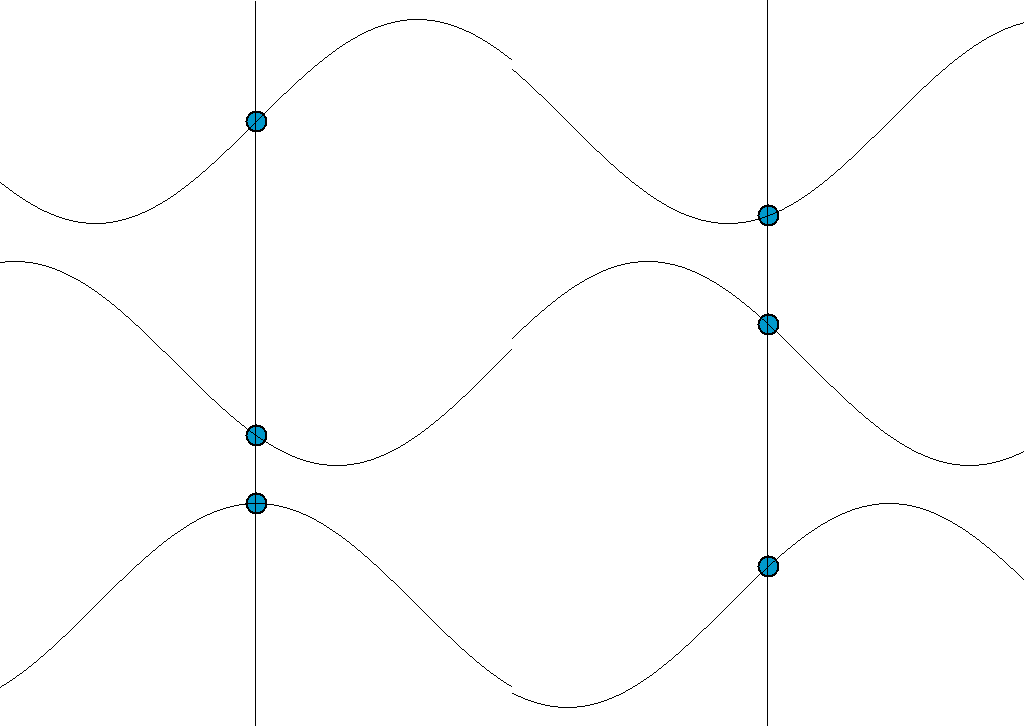
This wave displacement (the y-axis of your graph) is tracing out a simple harmonic motion, i.e. oscillating between -A and +A in a sinusoidal fashion. A more illuminating way (which is more natural in fact) of imagining this would be to consider a wave in general any sinusoidal wave and look at the motion of any specific single point on such a waveform as a function of time. It looks something like this (borrowing from wikipedia):

Thus, every point undergoes simple harmonic motion, with its displacement from the mean value oscillating between $-A$ to $+A$. !This periodic motion is characterized by some time period $T$, or in terms of its inverse, frequency $\nu$.
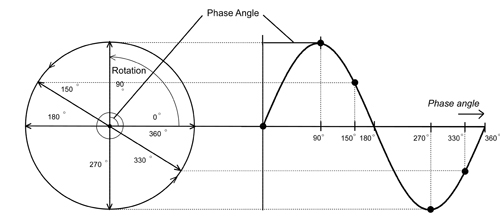
On the other hand, imagine a particle rotating in a circle. If you project this motion on the diameter of this circle, it is again simple harmonic motion. The correspondence looks somewhat like this:

This correspondence is easier to see with maths, however I will avoid going into it at first go (let me know through a comment if you want that, I will be happy to edit and incorporate!)
Now, this correspondence gives us one very good benefit, which is to draw an analogy. Since any two points on a circle shall have the same distance from the origin, they are separated only by the angular co-ordinate $\theta$. Take for example your wall clock. If you take the 12'o clock mark as a standard with respect to which you measure angles, the 3'o clock mark
will make an angle $90^{\circ}$ w.r.t. the zero mark and the 9'o clock mark
is further ahead by an angle $180^{\circ}$. Thus, these angles define in a sense, the position of the point on the circle. As a last step, consider the special case of uniform circular motion, i.e. the circle is being traced at a uniform rate $\omega = \frac{d\theta}{dt}$ where $\omega$ is called the angular frequency. Thus, at any instant of time, $\theta = \omega t$, which is called the instantaneous phase, defines for you the position of the particle on this equivalent circle, relative to the zero mark.
The particle on the circle completes a full rotation when it has traversed full $360^{\circ}$, and reaches the diametrically opposite end on traversing $180^{\circ}$. Thus, its y-coordinate reads $-A$ in the second case. Thus, for some wave no. 2 which is $180^{\circ}$ ahead of some wave no. 1, it just like tracing out the same path but having started earlier than wave no. 1, it is already half way down the journey. So, it is effectively the same as being half a cycle ahead.
Just a couple short words of warning -
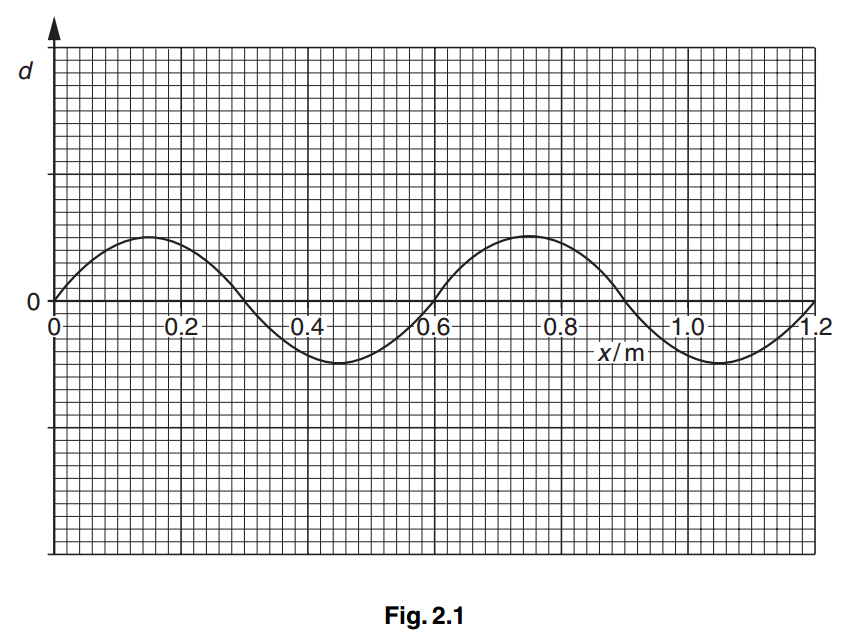
I talked in terms of time, while your graph talks in terms of distance, something like a spatial wave. It doesn't matter - the formulation extends over exactly.
In the clock analogy, I had set the zero mark at the 12'o clock mark, which was cleaner for that example, but is otherwise non conventional from the point of view of the phase definition. Generally, angles are measured from the x-axis, the 3'o clock mark. Clearly however, it doesn't make any difference if you are OK with reading the phase as $\theta - \theta_0$, where $\theta_0$ is initial phase, at $t=0$, or epoch, as they call it.


