1
$\begingroup$

I am having trouble grasping how the equation

$\bar{E} \left( \bar{r}, t \right) = \bar{E}_{0} \exp \left[ i \left( \bar{k} \cdot \bar{r} - \omega t \right) \right]$

fully describes a plane wave.

My current understanding is if we consider only the $\exp (i \omega t)$ part, that describes a point on the complex plane. This point moves around a circle as time increases. We can consider only the real part (x axis projection) of this point to essentially trace out our wave. I have tried to illustrate this below:
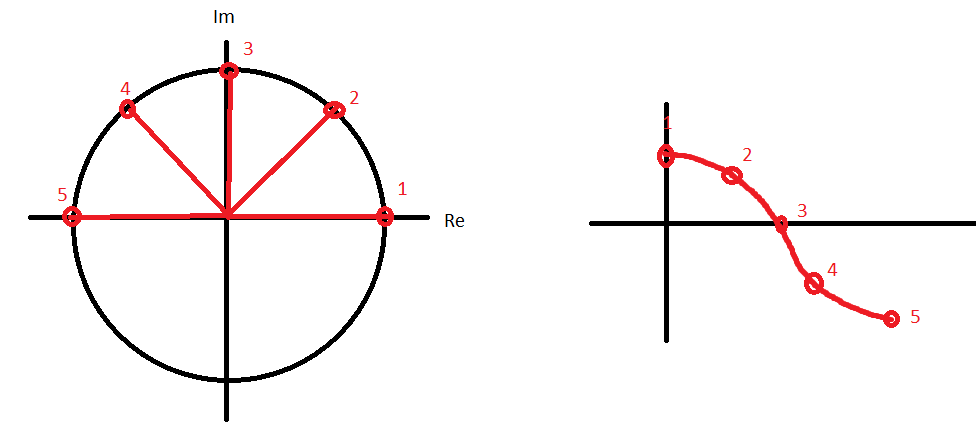
plane wave

My problem now is I cant see where the $\exp (i \bar{k} \cdot \bar{r})$ comes into play. I have read up about $k$ being the wave number, but just can't grasp its purpose or what it means physically, since my current plot can give a full illustration of an E-M wave.

Is there a way to visualize the purpose of the $i \bar{k} \cdot \bar{r}$ bit, like I have done with the $i \omega t$?

Thanks

$\endgroup$
1
  • 2
    $\begingroup$ The $\mathrm{e}^{\mathrm{i}\omega t}$ traces out the time behaviour of an oscillator at a point, not that of a wave. $\endgroup$
    – ACuriousMind
    Commented Nov 13, 2014 at 14:41

2 Answers 2

5
$\begingroup$

A picture is worth a thousand words. Here's how it looks as a function of space, evolving in time:

enter image description here

Here blue is real part, and purple is imaginary part of the complex exponent $\exp(i(kx-\omega t))$.

If you instead just look at $\exp(-i\omega t)$, you'll get this:

enter image description here

$\endgroup$
3
  • $\begingroup$ I like the animations, but would suggest a couple of small improvements. First, change the text just above your second plot - "If instead you look at just $e^{-i\omega t}$ at all points in space (without the $ikr$ part in the exponential) then all points would move at the same time:" - and then below, a takeaway like "As you can see, you need the $ikr$ part to describe the spatial variation of the wave". Because even pictures need some words, sometimes. $\endgroup$
    – Floris
    Commented Nov 13, 2014 at 15:32
  • $\begingroup$ Thanks, I never figured that about the just $\exp(-i \omega t)$. So is there a way to visualize just the $\exp(i k r)$, like you've done the $\exp(-i \omega t)$? $\endgroup$ Commented Nov 13, 2014 at 15:51
  • $\begingroup$ @SteveHatcher - yes, just stop the animation of the top picture and you have it... $\endgroup$
    – Floris
    Commented Nov 13, 2014 at 15:53
1
$\begingroup$

If you look at a wave at a moment in time, you can see how it varies spatially by plugging in different values of r: $e^{ikr}$. If you look at a point in space, you can see how it varies in time by fixing r and varying t: $e^{-i\omega t}$.

If you want the behavior in both space and time, you end up with the expression you have - and you can see how the speed of propagation relates to $k$ and $\omega$.

$\endgroup$
2
  • $\begingroup$ Thanks for your answer, just to clear some things up: so the $\exp(-i \omega t)$ represents the temporal evolution of the wave, and the $\exp(i k r)$ represents the spatial disturbance based on that temporal evolution? I don't fully understand what you mean by "how it varies spatially by plugging in different values of r". $\endgroup$ Commented Nov 13, 2014 at 15:54
  • 1
    $\begingroup$ Yes. If you set $t=0$ for example, you will compute a different amplitude / phase for different points on the wave. Just consider the 1D case (r = x) - $e^{ikx}$ which describes a cosine centered on x=0. When you work in 3 dimensions, the same thing still holds (although you need the dot product to figure out how many wave cycles you have traversed in a given direction). Is that clearer? $\endgroup$
    – Floris
    Commented Nov 13, 2014 at 15:59

Your Answer

By clicking “Post Your Answer”, you agree to our terms of service and acknowledge you have read our privacy policy.

Not the answer you're looking for? Browse other questions tagged or ask your own question.