To start with, I need to write a list of assumptions that are at play, and numerous disclaimers are needed. Firstly, the IPCC scientists don't say this follows a $\ln$ function at all. They say it follows whatever their computer models says it follows. This is only a first order solution. Assumptions begin here:
- We are considering one gas
- We are only considering outgoing thermal radiation blockage from the Earth
- We are only considering one absorption peak in the absorption spectrum of this gas
- This absorption peak is both sufficiently narrow and sufficiently close to the peak of outgoing radiation spectrum that the outgoing radiation as a function of wavelength at sea-level is effectively constant over the entire absorption peak
- The cross section as a function of energy around the peak follows an exponential decrease on both sides of the peak
- It is a valid approximation to say that for any given wavelength, either ALL or NONE of the outgoing radiation is absorbed, corresponding with the optically thin or thick characterizations.
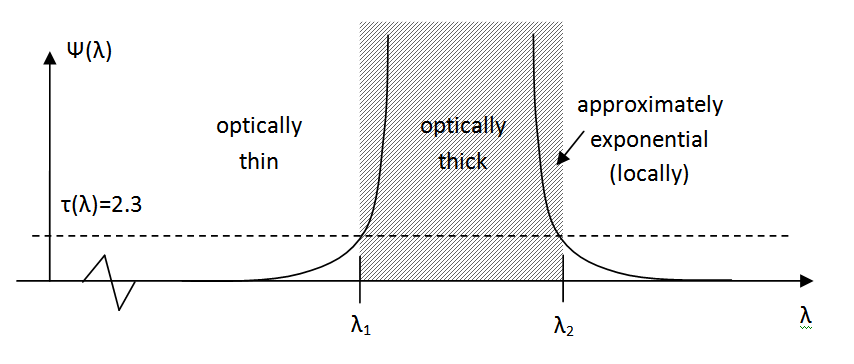
One more assumption may or may not be necessary, reflecting my own imperfect knowledge, which is that the exponential declines quickly relative to the width of the peak. Also, I am referring to cross section, but I really mean the cross section specific to the thermal distribution of the CO2 molecules - just one of the finer details that I do not care much about. The following is my illustration of the assumption the model under discussion makes about the form of the effective cross section as a function of wavelength of light.

The approximation above is a Taylor series expansion of the effective cross section around $\lambda_1$ and $\lambda_2$ in a $ln$ scale. This is to say the following for points around the left edge. I will just keep to the left edge because the right part follows in the same way and isn't worth typing.
$$\ln( \Psi(\lambda) ) = \ln( \Psi(\lambda_1) ) + \gamma \Delta \lambda$$
$$ \Psi(\lambda) = \Psi(\lambda_1) e^{ \gamma \Delta \lambda }$$
The above includes an assumption about the form of the absorption peaks of the CO2. If you were mathy, you might be able to get this from a Gaussian or a broadened absorption peak, I just want to note it real quick b/c I won't be commenting on the validity. Next, I need to write the equation for the optical thickness, $\tau$ as a function of energy, then mutilate the radiation forcing expression, $F$ into a piecewise function. Also, $C$ is the concentration of carbon dioxide and $N_{Air}$ is the volume density of gas molecules in the atmosphere. I'll also write it again for the specific region around the left edge for which $\Delta \lambda = \lambda - \lambda_1$.
$$\tau(\lambda) = C N_{Air} \Psi(\lambda) = C N_{Air} \Psi(\lambda_1) e^{ \gamma \Delta \lambda }$$
Optically thick is defined by $\tau>2.3$. We will write the energy dependent flux coming off the ground as $\Phi(\lambda)$. By the previously stated assumption, $\Phi(\lambda) \approx \Phi$. $F$ is proportional to the absorbed/reflected $\Phi$ by some constant I don't care about, $\beta$.
$$F_{CO2} = \int_0^{\infty} \beta \Phi (1 - e^{-\tau(\lambda)}) d\lambda$$
$$(1 - e^{-\tau(\lambda)}) \approx \begin{cases}
0, & \mbox{if } \tau(\lambda) < 2.3 \\
1, & \mbox{if } \tau(\lambda) \ge 2.3
\end{cases}$$
$$F_{CO2} = \beta \Phi \left( \lambda_2 - \lambda_1 \right) $$
If you just gawked or gagged at that... all I can say is don't shoot the messenger. In fact, we don't even really need that $\beta$ there for the purposes of this question. Anyway, I hope it's clear where we're going, and at this point I will assign $\lambda_1$ and $\lambda_2$ to be pre-industrial values. The physical effect humans have had on the greenhouse effect, by this model, is to broaden the range of wavelengths that CO2 in the atmosphere absorbs. To put this into math, I will say that $\lambda_1'$ and $\lambda_2'$ are the corresponding post-industrial values. Also, I will use $C$ as post-industrial concentration, $C_0$ as pre-industrial, $\tau$ and $\tau'$, and $F$ and $F'$ respectively.
$$\Delta F = F_{CO2}'-F_{CO2} = \beta \Phi \left( (\lambda_2' - \lambda_2) + (\lambda_1 - \lambda_1') \right)= \beta \Phi \left( \Delta \lambda_2 + \Delta \lambda_1 \right)$$
Now here is the beef, we can find $\Delta \lambda_1$ from the prior Taylor series expansion. Remember, the edge of the absorption peak, the point that separates the optically thick and thin regions, comes from that magic 2.3 value. The driving force behind this is, of course, the change in concentration $C$. For clarity I'll note that $\Delta \lambda_1 = \lambda_1-\lambda_1'$. You'll probably be confused by the negative, it's just math trickery in order to account for the fact that we're on the left (negative) side of the peak, and thus get the right $C$ on top.
post-industrial
$$\tau'(\lambda) = 2.3 = C N_{Air} \Psi(\lambda_1) e^{ -\gamma \Delta \lambda_1 }$$
pre-industrial
$$\tau(\lambda) = 2.3 = C_0 N_{Air} \Psi(\lambda_1) $$
The answer to my question follows with algebra now. Just assume $\Delta \lambda_2$ to be the same thing, not that the constant matters anyway.
$$\Delta \lambda_1 = \frac{1}{\gamma} \ln{\frac{C}{C_0}}$$
$$\Delta F = \frac{ 2 \beta \Phi}{\gamma} \ln{\frac{C}{C_0}}$$
Finished. Although I probably used more space than what I needed to. And just for the record, this does matter, since discussions with the IPCC scenarios involve values of $C/C_0$ of 2 to 3. If you just used the decreasing exponential you will get a very different answer. The problem in a nutshell is a cross section that varies so starkly with wavelength. The $1-e^{-\tau}$ was always recognized to be mono-energetic. The $ln$ alternative is for the exact opposite scenario where it completely blacks out energy ranges and the mathematical form of the absorption peaks give rise to the Taylor series used here.
The reference for this work was posted by Michael Luciuk in the comments.
http://www.princeton.edu/~lam/documents/LamAug07bs.pdf
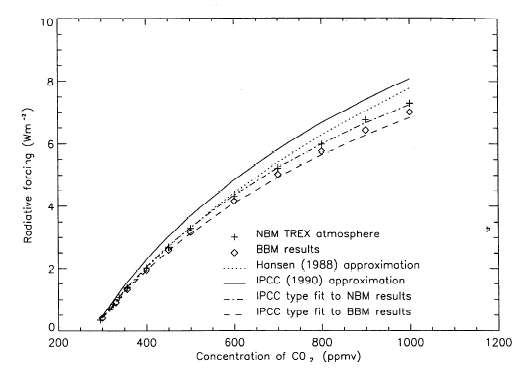
And people have, of course, pointed out that the real behavior doesn't exactly follow this model. Here is some real data. I found it to look surprisingly logarithmic. Source


