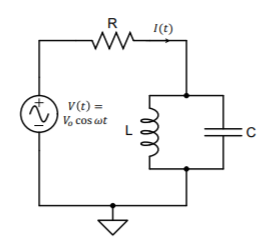
Given the following RLC circuit with an AC driving source,
I have found an expression for the amplitude to be
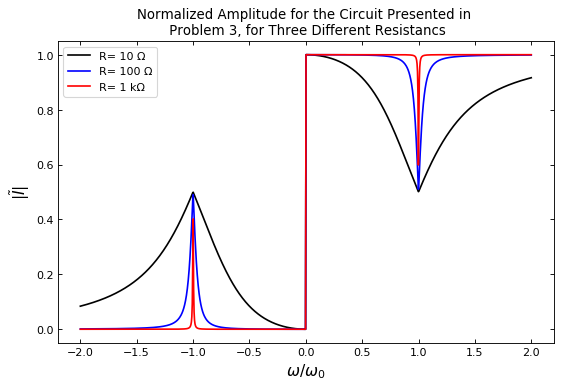
$$ I(t) = \left(\frac{V_{0}}{R}\right)\frac{(\omega \tau)}{\sqrt{(\omega\tau)^{2} + \left(\frac{\omega^{2} / \omega_{0}^{2}}{1 - \omega^{2}/\omega_{0}^{2}}\right)^{2}}}, \tag{Equation 1} $$ which when plotted using Python for three different values of $R$ whilst simultaneously normalizing each plot's amplitude from $0$ to $1$, yields the following result :
From here I was wondering if the resonance plot is the right hand side figure or the left hand side. Because, wherever I look on the internet or any available literature, the resonance plot is similar to that of the left of this figure. But, in that case the frequency ration $\omega / \omega_{0}^{2}$ is negative , which doesn't make sense to me. Could a resonance plot , be reverted ,i.e., it is the right hand side plot ?
My reasoning is that it is the right hand side plot , i.e the domain $[0, 2]$ ,because a negative frequency ratio is unrealistic for the given circuit. While negative currents are possible I don't see how a negative frequency would be possible as well. I guess that this whole negative frequency thing arises from the square root of the denominator in Equation 1, which in return allows for a negative frequency ratio, but in a real setting I presume that we implicitly assume $\omega >0 \implies \omega/ \omega_{0} > 0 \ \forall \omega.$


