3
$\begingroup$

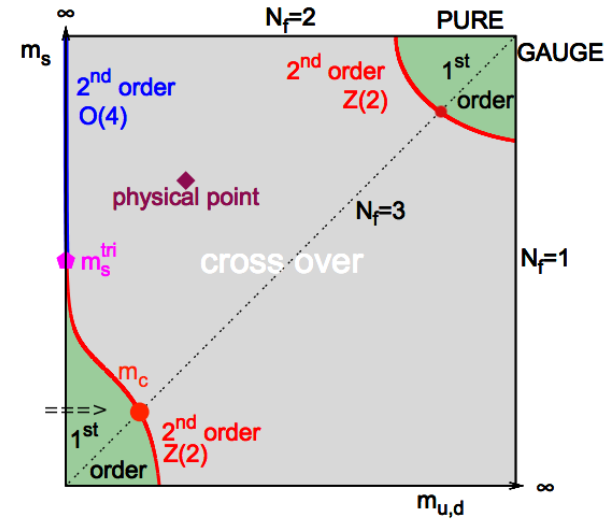
In High Energy Physics papers, I often see a diagram as shown below:

Colombia Plot taken from: https://arxiv.org/abs/2102.07604

I am still studying Quantum Field Theory, and I could not understand the only reference I could find about this plot: https://arxiv.org/abs/1702.00330. What I know for sure is that the y-axis is strange quark mass, $x$-axis is light quark ($u$ and $d$) mass. And the third axis coming out of the plane is chemical potential ($\mu = 0$).

  1. What are the various features of this plot (in a simpler language)?
  2. Why are masses taken as variables when we know their values to be constants?
  3. What is the significance of this plot?
  4. How is it related to QCD phase diagram?
$\endgroup$
1

2 Answers 2

3
$\begingroup$

Overall, such a Columbia plot tells you what kind of phase transition (between the confined, hadronic phase and the deconfined quark-gluon plasma phase) can be observed for specific values of the quark masses. For intermediate quark masses, a crossover is generally observed while regions characterized by first-order phase transitions are found in the limit of heavy as well as light quarks. These regions are separated from the crossover regime by critical lines of $Z(2)$ second-order phase transitions. It should be noted that the behavior for small quark masses is subject to current research and that the variant you posted here is not the only possibility.

The quark masses are given as variables as one can study arbitrary masses in lattice QCD calculations. Particularly, it is generally easier to work with heavier and/or degenerate masses from a computational point of view. Besides that, it is also of theoretical interest how QCD behaves in certain (unphysical) regimes.

The diamond labeled 'physical point' corresponds to the quark masses found in nature and is the only point in the Columbia plot which is directly related to the QCD phase diagram. It corresponds to the point at $\mu=0$ at which the phase transition occurs ($T_c\approx 150\,$MeV). The fact that a crossover is observed is often represented by a dashed line in the phase diagram.

There also exist three-dimensional variants of the Columbia plot in which the baryochemical potential is added as a variable. These explore the type of the QCD phase transition away from the $\mu=0$ axis. These calculations are, however, more complicated due to the appearance of a so-called sign problem.

$\endgroup$
3
  • 2
    $\begingroup$ To complement a little (although I agree with the answer): knowing the phase diagram for varying masses can also help to understand the physics of QCD at the physical value of the masses. Knowing for instance that we are close to a phase transition can help understand why some energy scale are very low (similarly to weakly broken continuous symmetry allows to understand the low mass of pions). $\endgroup$
    – Adam
    Commented Mar 16, 2021 at 11:41
  • $\begingroup$ Thanks for the interesting extension. Which energy scales come to your mind here? $\endgroup$
    –  Mio
    Commented Mar 16, 2021 at 15:04
  • 1
    $\begingroup$ Close to a second-order (quantum) phase transition, the correlation length of some correlation function $\xi$ diverges (equivalently the mass $\propto \xi^{-1}$ vanishes). To what collective excitations it would correspond for QCD is beyond my knowledge of the subject, unfortunately... most probably some baryon or meson I guess. But the point is that knowing that one is close to a phase transition allows for explaining the low mass, which might appear mysterious otherwise (because it is an emergent phenomenon). $\endgroup$
    – Adam
    Commented Mar 16, 2021 at 20:25
1
$\begingroup$

The masses on the axis of the Columbia plot are so-called lattice masses not the physical masses. They depend on the lattice spacing $a$ (not shown in the figure). For the case, a mass tends to infinity it decouples from the dynamics (or from the theory) and hence does not contribute to the thermodynamics anymore. That's the reason why there are different $N_f$ (number of active quark flavors) shown on the axes.

The upper right corner corresponds to the special case where all masses are decoupled from the dynamics. This case is labeled as pure gauge and means that the dynamics is govern mainly by gluons without any (explicit) quark contributions.

The other extremum is the left lower corner where all masses vanishes. This case is also denoted as the chiral limit of QCD (i.e., QCD in the limit where all $N_f=3$ quark masses are zero). For this case chiral symmetry (here the $SU(3)_L \times SU(3)_R$) is realized and not broken explicitly by any quark mass. As a side remark: chiral symmetry in the vacuum (or low temperature) is still broken spontaneously.

The diagonal dashed line with $N_f=3$ corresponds to the case where all three quark masses (two light degenerated quark masses, the up and down quark, and one strange quark mass) are degenerated (meaning that they have the same value).

Thus, we see that only for extrem values of the quark masses (i.e., for the chiral limit and for pure gauge) QCD (on the lattice) predicts a chiral (left lower) and deconfinement (right upper) phase transition of first-order (the green regions in the plot). In between (where also the point of the physical quark masses lies) a smooth crossover (no sharp phase transition) takes place between a chirally broken phase (at low temperature) and a chiral symmetric phase at high temperature. Note, that the baryon density vanishes since the quark chemical potential is zero ($\mu=0$) here.

Since for general thermodynamical reasons a first-order phase transition terminates in a second-order end point the green regions have a red boundary line denoting a second-order (chiral or deconfinement) transition for these mass values.

Translated to the common QCD phase diagram where the order of the (chiral or deconfinement) phase transition is shown in a two-dimensional figure, temperature $T$ versus density $n$ (or chemical potential $\mu$), one point of the Columbia plot means that the corresponding phase transition as a function of temperature (and for $\mu=0$) has a certain order for the given quark masses.

However, this Columbia plot is quite an old one: it is still an open issue whether the first-order green area around the chiral limit stops at a tricritical strange quark mass value labeled as $m_s^{tri}$ in the figure. Possible scenarios which are currently discussed, are an extended green region up to the upper $N_f =2$ axis (depending on the axial $U(1)_A$ anomaly of QCD) and whether the blue vertical line is a second-order transition with really an $O(4)$ critical universality.

$\endgroup$

Your Answer

By clicking “Post Your Answer”, you agree to our terms of service and acknowledge you have read our privacy policy.

Not the answer you're looking for? Browse other questions tagged or ask your own question.