6
$\begingroup$

How does one distinguish between the second-loop contribution of a known particle, and the first-loop contribution of a more massive-and as yet undiscovered-particle in the S-matrix and/or differential cross section?

Imagine: I calculate a one-loop correction to some scattering process in QED. My photon propagator needs to be corrected for all three lepton generations. I then calculate the differential cross section. The experimentalist then shows me a plot of his precise measurements and tells me that my calculations need further corrections.

Question: How do I know that the necessary correction is from two-loop diagrams, and not from a fourth lepton in the first-loop diagram that I haven't considered?

$\endgroup$
3
  • $\begingroup$ Huh, because they are quite different beasts? $\endgroup$
    – OON
    Commented Nov 1, 2016 at 8:06
  • $\begingroup$ Please elaborate in what context. If experimentally - you calculate for both models and look what fit observations better. $\endgroup$
    – OON
    Commented Nov 1, 2016 at 8:15
  • $\begingroup$ I modified my question. Does it help? $\endgroup$ Commented Nov 1, 2016 at 10:43

1 Answer 1

4
$\begingroup$

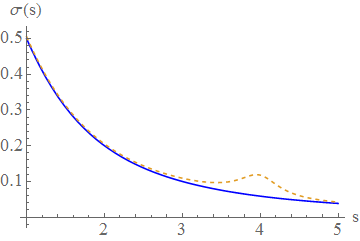
Made up example:

enter image description here

where the solid line represents the one-loop calculation, and the dashed one the two-loop one.

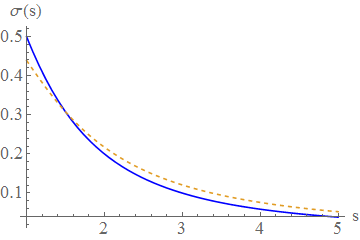
On the other hand,

enter image description here

where the solid line represents the one-loop calculation with three generations, and the dashed one represents the one-loop calculation with four generations (the new particle has a mass close to $s=4$ in this scale).

In other words: more loops slightly change the overall look of the cross section. More particles change its behaviour close to the mass of such particles.

$\endgroup$
5
  • $\begingroup$ Interesting. So what these plots say is that higher order loops change the diagram as a whole, whereas a new particle would merely show up as a bump. The only question I have is how come the three original leptons didn't show up as bumps near their respective masses? $\endgroup$ Commented Nov 1, 2016 at 12:42
  • $\begingroup$ They actually do show up in their respective masses! My diagram only shows the fourth bump for simplicity. $\endgroup$ Commented Nov 1, 2016 at 12:46
  • $\begingroup$ What are their masses in this scale? $\endgroup$ Commented Nov 1, 2016 at 12:46
  • $\begingroup$ This is a made up diagram, it doesn't correspond to anything physical. It's only meant to illustrate the general trend of loop corrections and resonances. In this case, you can take the three first masses to be, say, very close to the origin (so that they can be treated as massless). $\endgroup$ Commented Nov 1, 2016 at 12:48
  • $\begingroup$ @OptimusPrime no problem. If you have any more questions, feel free to ask. $\endgroup$ Commented Nov 2, 2016 at 18:03

Your Answer

By clicking “Post Your Answer”, you agree to our terms of service and acknowledge you have read our privacy policy.

Not the answer you're looking for? Browse other questions tagged or ask your own question.