0
$\begingroup$

Ok, so I have been performing a lab experiment in class involving resistors. We were asked to set up 3x 47Ω resistors in 6 different combinations in a circuit with a 6V power supply. We also attached a resistor of unknown resistance (later revealed to also be 47Ω). An ammeter and voltmeter were also connected.

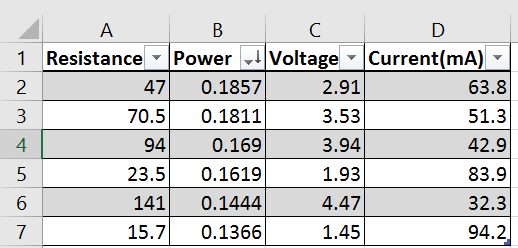
I did the experiment, recording my results in this table:
enter image description here

The 70.5, 23.5, and 15.7 circuits were where resistors are in series, but given I've calculated the resistance there shouldn't be any difference. We were then asked to draw a graph: enter image description here
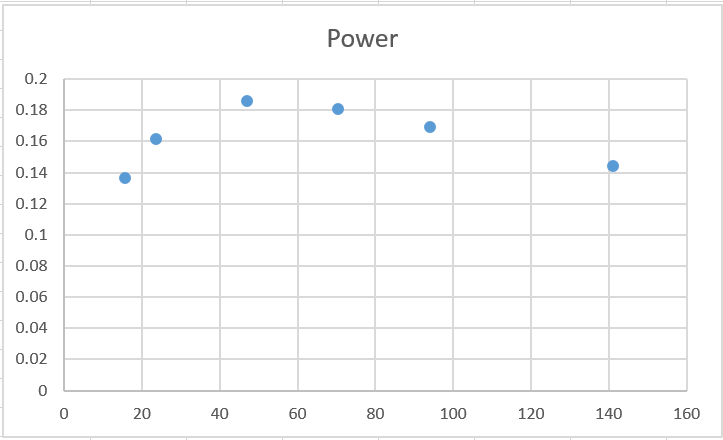
Using my knowledge of the Power & Resistance equations, I would expect this to be a straight line graph, but I cannot think of any reason the graph has this unusual shape. Is it because of the 'unknown' resistor? And if so, why?

$\endgroup$
1
  • $\begingroup$ Your description of the circuits makes no sense. The only way to get $15.7\,\Omega$ is with 3 of the resistors in parallel, yet you say something is in series. The $23.5\,\Omega$ resistance is 2 in parallel only. You also don't say which voltage you are measuring, nor which current you are measuring. Where is the unknown in the circuit. $\endgroup$
    – Bill N
    Commented Mar 7, 2016 at 17:29

5 Answers 5

2
$\begingroup$

While you did not say so explicitly in your question, I assume that the "unknown resistor" was outside of the part of the circuit for which you measured the voltage and current.

If that is so, then we can consider the unknown resistor to be part of the "internal impedance of the source", and you just confirmed the fact that you get the greatest transfer of power from a source to a load when the impedance of the load is equal to the impedance of the source.

This happens because as you make the external (load) resistance smaller, a larger fraction of the voltage drops over the internal (source impedance) resistor. This means that you lose more power in the source, and less voltage is available to give you power externally.

See for example this earlier answer for some details of the math (in particular, why the max occurs where $R_i$ = $R_L$).

Your power curve peaks around 47 ohms - as expected.

$\endgroup$
2
$\begingroup$

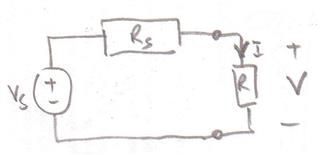
This looks like a voltage source $V_s$ with source resistance $R_s$ (the unknown resistor) in series with the resistors $R$ that you are varying.

enter image description here

Assuming that the voltage across the resistor $R$ is $V$ then

$V_s = V + IR_s \Rightarrow V = - R_s I + Vs$

So a graph of $V$ against $I$ should be a straight line with intercept on the $V$ axis $V_s$ and on the $I$ axis $\frac {V_s}{R_s}$.
The gradient of the line should be $-R_s$

Now if you plot power dissipated in resistors with the resistance that you varying against the resistance of the resistors that you varying $R$ you should not get a straight line because

$P = I^2 R = \left (\dfrac {V_s}{R_s+R} \right)^2 R$

Notice that for small $R \ll R_s $ the power tends to zero and for large $R\gg R_s$ the power also tends to zero.
So in between those two extremes the power reaches a maximum.

From you graph you can estimate the value of $R$ when that occurs.
This is the condition for maximum power transfer from the voltage source $V_s$ which has a resistance $R_s$ to the resistor $R$.

You can find the value of $R$ for maximum power transfer by differentiating the power with respect to $R$ and putting the result equal to zero $\frac{dP}{dR} = 0$

$\endgroup$
1
  • $\begingroup$ +1 - This nicely complements what I wrote... including the diagram and equation . $\endgroup$
    – Floris
    Commented Mar 7, 2016 at 17:28
0
$\begingroup$

Power is directly proportional to the square of the current and its also directly proportional to the square of the voltage. Since you said you knew the power equation and resistance equation (I assume u are talking bout ohm's law), you should have aware the equation for the power is never been linear, its more like quadratic.

So nothing to wonder when your plot turn up exactly like the y=x^2.

$\endgroup$
1
  • 1
    $\begingroup$ This is a plot of power as a function of load resistance, and you don't expect that to look like a parabola at all. $\endgroup$
    – Floris
    Commented Mar 7, 2016 at 17:26
0
$\begingroup$

Power goes as either $V^2/R$ or $I^2R$ from Ohms laws (or $P=IV$). I assume that you expect this to be linear because of the equation $P=I^2R$, which would be linear in $R$ for a fixed current. But your current in this case is not fixed, but decreases with increasing resistance. Given the numbers that you have in the table, you can calculate $P$ from the above equations and make sure everything holds at least approximately true given experimental error. Also, check to make sure that Ohms law ($V=IR$) is true for your measurements.

$\endgroup$
0
$\begingroup$

You said, "...6V power supply", but the Voltage in column C of your table is different in each experiment.

Your plot shows two variables, resistance vs. power, but since you are computing power as the product of two variables, Voltage and current, you really have three variables in the experiment: Voltage, current, and resistance.

A plot that does not show all three is meaningless.

Your experiment would be more meaningful if you could keep either the Voltage or the current constant across all measurements.

$\endgroup$
4
  • $\begingroup$ The way the experiment was described and set up meant that we changed the resistance, we couldn't control the voltage. $\endgroup$
    – jcrossley
    Commented Mar 7, 2016 at 15:15
  • $\begingroup$ @jcrossley If your apparatus can not either force a constant Voltage or a constant current, then your plot of resistance vs. power will not mean anything. $\endgroup$ Commented Mar 7, 2016 at 16:13
  • $\begingroup$ @jcrossley, . Any decent bench power supply should be able to supply either constant Voltage or constant current (within some reasonable range, of course.) Back when I was a student, a power supply would have two knobs; one to limit the Voltage and one to limit the current. Whichever one you wanted to control, you'd crank the other knob up to its maximum setting. I don't know what the controls on a modern bench supply look like. $\endgroup$ Commented Mar 7, 2016 at 16:19
  • $\begingroup$ I'm pretty sure the experiment is expected to show that power dissipated is a maximum when the load resistance equals the source resistance - which it does nicely. But I agree that it is not well defined; I expect that is as much because of OP's confusion about what the experiment is supposed to show, as it is because the experiment was poorly described in the assignment. $\endgroup$
    – Floris
    Commented Mar 7, 2016 at 19:20

Not the answer you're looking for? Browse other questions tagged or ask your own question.