3
$\begingroup$

I have a simple question regarding galactic rotation curves. I know they are studied mostly using 21 cm emission of Hydrogen in the outer regions and with CO emissions in the inner regions, but why do the velocities slightly differ? See this one for example and don't mind the disc, bulge, gas, and halo curves:
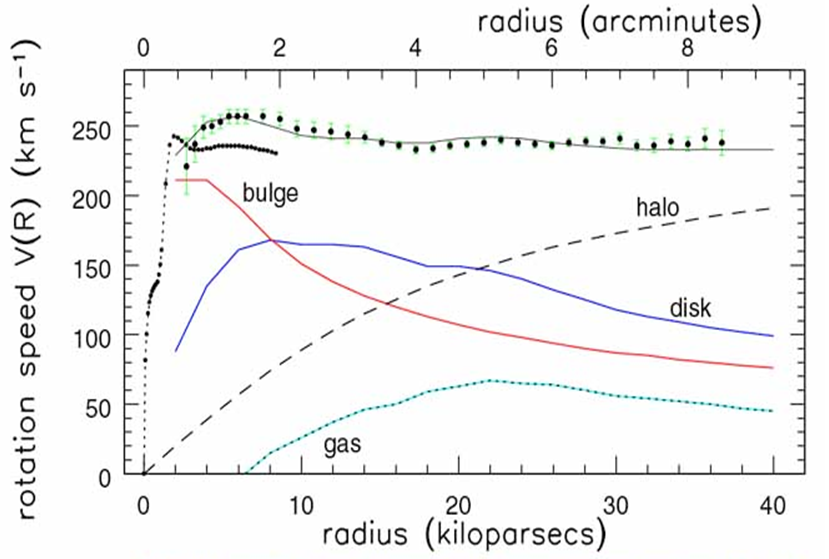
http://i.imgur.com/LuazW6v.png

This is from Sparke & Gallagher's Galaxies in the Universe (Amazon link). The figure caption says,

Points give the rotation curve of NGC 7331, as found from the HI map of Figure 5.13; vertical bars show uncertainty. CO gas (dotted), observed with a finer spatial resolution, traces a faster rise. The lower solid curves show contributions to V(R) from the gas disk, the bulge, and the stellar disk. A dark halo (dashes) must be added before the combined rotation speed (uppermost curve) matches the measured velocities – K. Begeman and Y. Sofue

$\endgroup$
4
  • $\begingroup$ Can you provide a link to the paper you got the figure from or describe what it shows in considerably more detail. $\endgroup$
    – ProfRob
    Commented Dec 8, 2014 at 17:23
  • $\begingroup$ Hi! Sure, sorry. The graph is from figure 5.20 of 'Galaxies in the Universe'. Description linked to the figure: "Points give the rotation curve of NGC 7331, as found from the HI map of Figure 5.13; vertical bars show uncertainty. CO gas (dotted), observed with a finer spatial resolution, traces a faster rise. The lower solid curves show contributions to V(R) from the gas disk, the bulge, and the stellar disk. A dark halo (dashes) must be added before the combined rotation speed (uppermost curve) matches the measured velocities – K. Begeman and Y. Sofue." $\endgroup$ Commented Dec 8, 2014 at 17:37
  • 1
    $\begingroup$ Unfortunately I can't find any astronomy paper by Begeman & Sofue, so it will remain a mystery until someone who knows the field a bit better than me can respond. Perhaps it is the issue of spatial resolution. $\endgroup$
    – ProfRob
    Commented Dec 8, 2014 at 17:47
  • $\begingroup$ @RobJeffries: I found a Google copy of the book. Might be a case of the authors asking for info from the two w/o a paper? $\endgroup$
    – Kyle Kanos
    Commented Dec 8, 2014 at 18:15

1 Answer 1

3
$\begingroup$

I can't really say what the significance of the result is that you show without some more details on what exactly is being shown in the picture and where it is from.

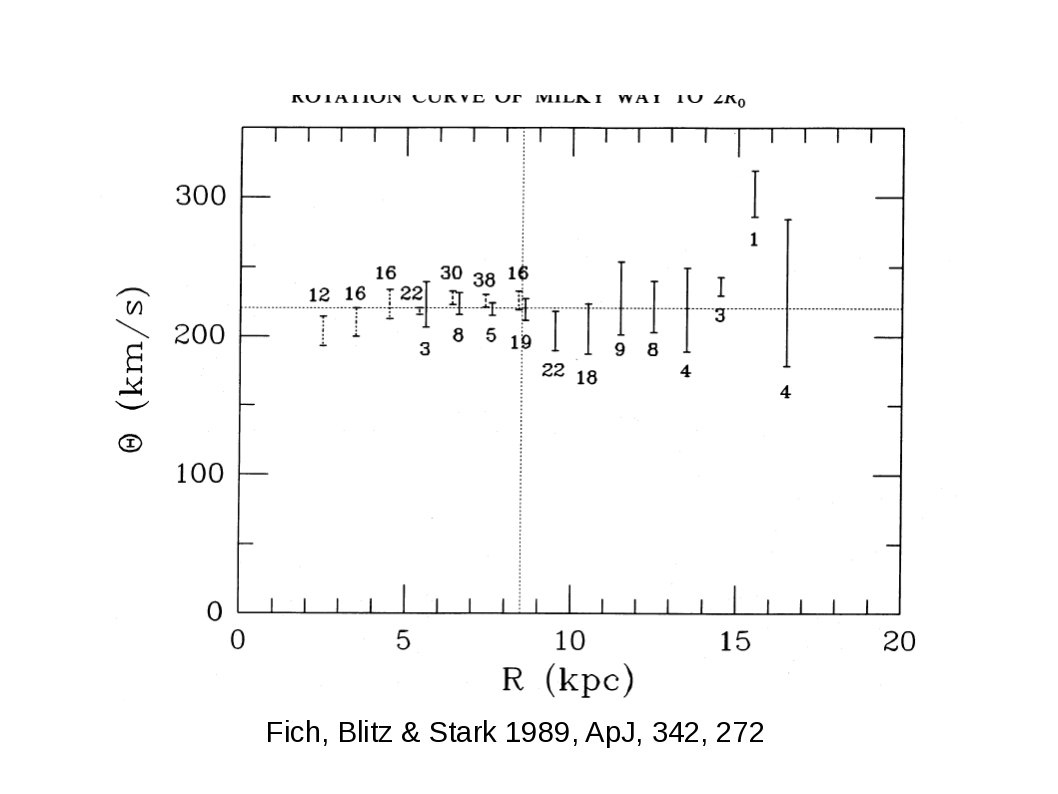
Here though is a counter-example from the well-cited study of Fich, Blitz & Stark (1989) for our own Galaxy, which appears to show excellent agreement where the two techniques overlap between 5 and 9 kpc. In this picture the CO measurements are the solid bars and the 21cm measurements are the inner ones with dashed points.

However, in distant galaxies spatial resolution can play an important role. The spatial resolution of the 21cm observations will be much lower than the CO observations. This will "smear" the observed rotation curve so that you get contributions from gas at a range of radii. This will become very important in the inner regions where the velocity changes rapidly with radius, The exact effect will depend on the intrinsic profile.

I don't really see how this explains the differences in the curves you show and in general I believe the agreements are much better than this, though it is normally the case that the CO measurements are trusted more in the inner regions. Is there anything peculiar about this galaxy? A molecular ring or a bar or some such feature?

Rotation curve from Fich et al. (1989)

$\endgroup$
2
  • $\begingroup$ It could be due to weird peculiarities, as you suggested. Thanks anyway! I thought I was forgetting something important and it turns out I am probably not. :) $\endgroup$ Commented Dec 8, 2014 at 18:21
  • $\begingroup$ These kinds of discrepancies are actually very common. I'm currently working a bit on understanding in detail where they come from so I don't have a final answer, but my hunch is that they come from the measurements being difficult and involving some complicated modelling before getting to an actual rotation curve, which leaves some room for these sorts of discrepancies to crop up. In addition, I think the error bars are often underestimated a bit (not maliciously, but for instance one might show statistical errors with bars but not systematics, which are harder to quantify). $\endgroup$
    – Kyle Oman
    Commented Jan 9, 2015 at 21:14

Your Answer

By clicking “Post Your Answer”, you agree to our terms of service and acknowledge you have read our privacy policy.

Not the answer you're looking for? Browse other questions tagged or ask your own question.