2
$\begingroup$

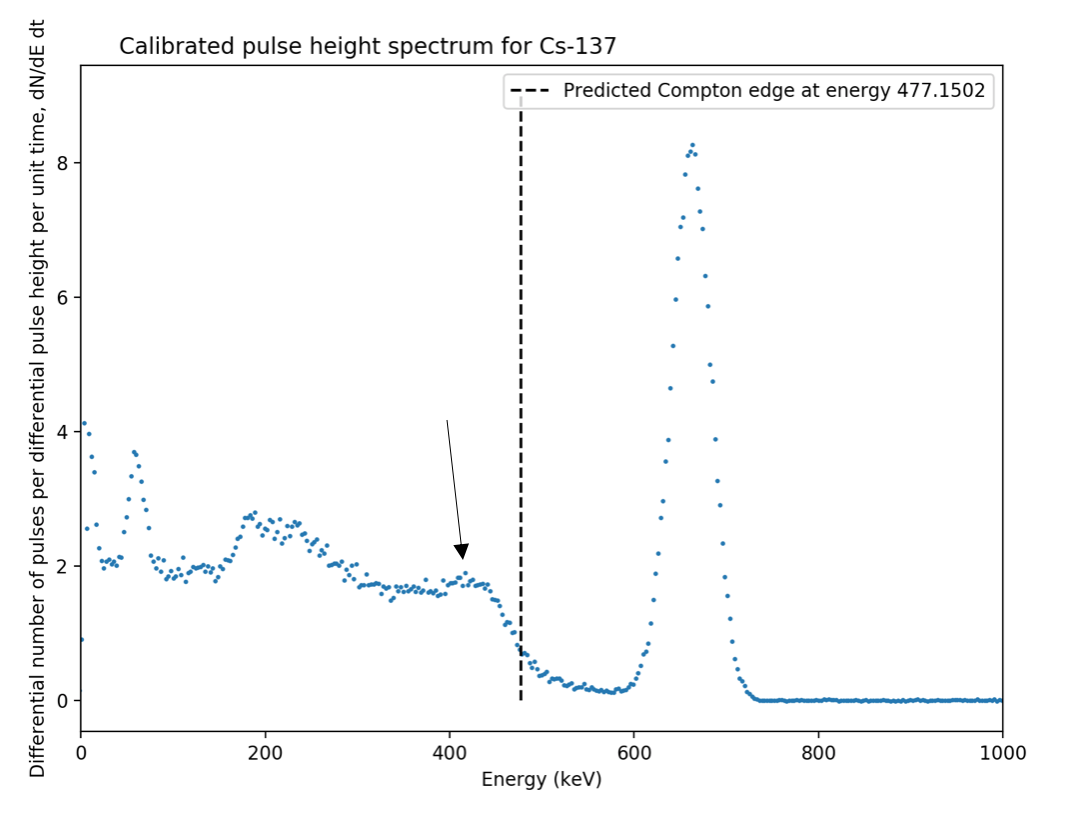
The following calibrated gamma ray spectrum was taken using data for a Cs-137 source acquired using an NaI scintillation detector. The predicted value of the Compton edge was calculated using the Compton scattering formula and is plotted as a straight line on the graph as shown below.

enter image description here

I thought that the Compton edge would be where the arrow is pointing. Can anybody explain why this is not the case? How could you determine this value for the Compton edge directly from the data?

$\endgroup$

1 Answer 1

1
$\begingroup$

It's just experimental resolution. The edge is a blur rather than sharp for the same reason the peak is spread out, not a spike. If you had a (more expensive) Germanium detector you would indeed see a sharp cutoff at 477 and a sharp spike at 662. If you take a sharp edge and smear it out you get the shape you see, and it starts to fall below the nominal value.

$\endgroup$
2
  • $\begingroup$ How would determine the exact value of the Compton edge with uncertainty from the data? For the photopeak, I fitted it to a Gaussian function but I don't know how to quantify what to fit the Compton edge to. $\endgroup$
    – Anna
    Commented Apr 7, 2020 at 7:28
  • 1
    $\begingroup$ Half way down is a pretty good estimator. If the edge is flat (which is not quite true) then at the limit 50% of the gamma energies will go up and 50% will go down, so the value is half the plateau. $\endgroup$ Commented Apr 7, 2020 at 7:41

Your Answer

By clicking “Post Your Answer”, you agree to our terms of service and acknowledge you have read our privacy policy.

Not the answer you're looking for? Browse other questions tagged or ask your own question.