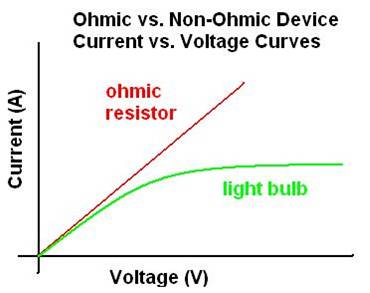
If the voltage and current of a circuit containing a light bulb are measured using a multimeter after consecutively lowering the voltage (building of a data set), what (type of) function will describe the trendline of the data when graphed (voltage as a function of current)? Is there a limit to the function or would it be theoretically exponential?
The goal of this is to find the resistance (graphically) of the bulb; which I do know will not be a constant value as the filament heats up. Is it good enough to assume a linear relationship and therefore use Ohm's Law, V=IR, as the basis for finding the resistance? Or is there a better way to do this?

