The important factor for r-process and s-process is a competition between
beta decay lifetime $\tau_{\beta}$ and speed of neutron capture $\tau_{n\gamma}$ (better: time between two neutron captures, not really a speed).
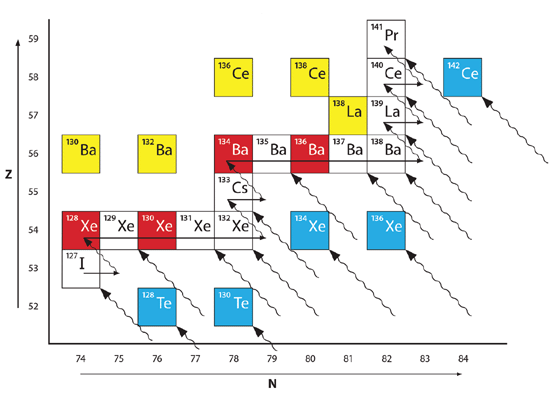
In the following picture, the boxes stand for stable nuclei. Once the s/r-process stops, everything else will (with time) decay to something stable following the North-West direction diagonal lines.

The s-process is a typical in a situation, where $\tau_{n\gamma} \gg \tau_{\beta}$. Nucleosynthesis will never go far beyond the stability line - it is always in the neighborhood of the boxes - the left-to-right line and then one NW $\beta$-decay line.
On the opposite, r-process arises in the situation, where $\tau_{n\gamma} \ll \tau_{\beta}$ for nuclei close to stability. Before the long-lived isotope decays, it gets one more neutron and the nucleosynthesis pushes all isotopes far from stability. Until the $\beta$-decay lifetimes are short enough to compete with the neutron capture.
Once the nucleosynthesis is switched off:
s-process stays more or less as it was.
r-process isotopes $\beta$-decay, until they reach the stability.
And now you can see in the picture 1, that sometimes these decay chains end surprisingly at some blue boxes, that effectively shield some isotopes from being generated by r-process. This way - blue are the isotopes not reachable by s-process (maybe with low probability, which means low amounts) and red are the isotopes not-reachable by r-process (I can imagine some extremely rare scenarios, but it is not the point, is it?)
BTW - yellow isotopes are shielded from both processes - and their origin is still a question.
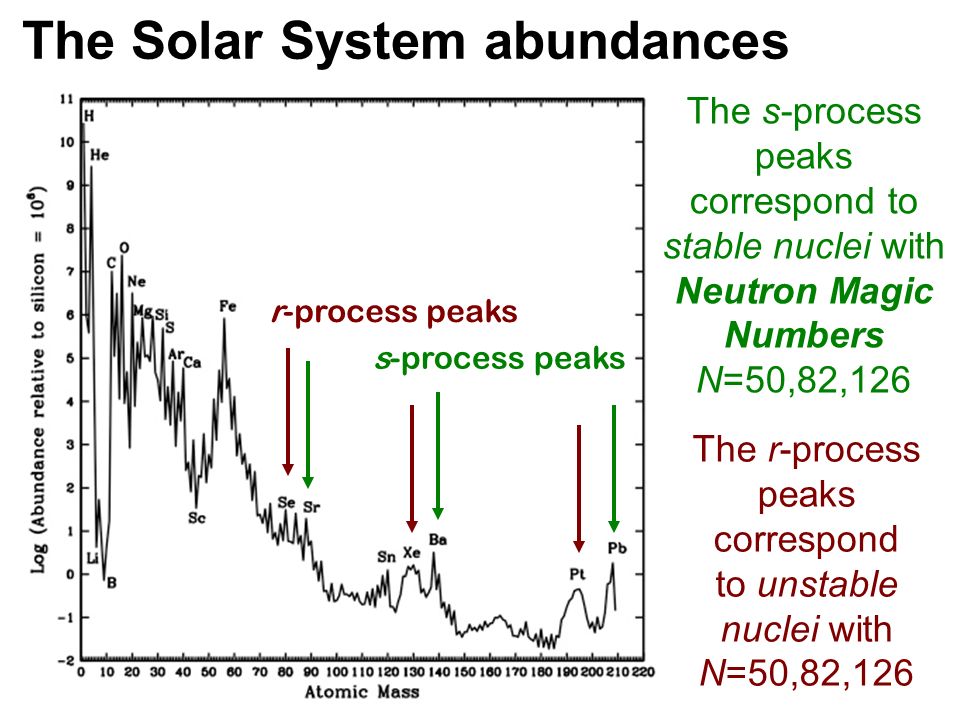
The next picture just illustrates the different peaks in abundances, $Sr$ has N~50, $Ba$ N~82 magic numbers, while the r-process nuclei have hit the magic numbers somewhere very far South-East in Terra Incognita and they have brought the information back.

Edit:
I picked-up the images randomly from web. The first one, I can see is used in https://answersingenesis.org/astronomy/solar-system/discussion-stellar-nucleosynthesis/ or https://uvachemistry.com/tag/s-process/ . The other one should be inside http://slideplayer.com/slide/10684436/ (I see it is from Maria Lugaro, an expert to the topic). The color codes - there is something is the text, but I cn cite the description from ref: The isotopes represented by white boxes result from either the s or r process. The blue boxes represent isotopes that result only from the r process, while the red boxes are s-only isotopes. The yellow boxes represent isotopes produced by proton capture.


