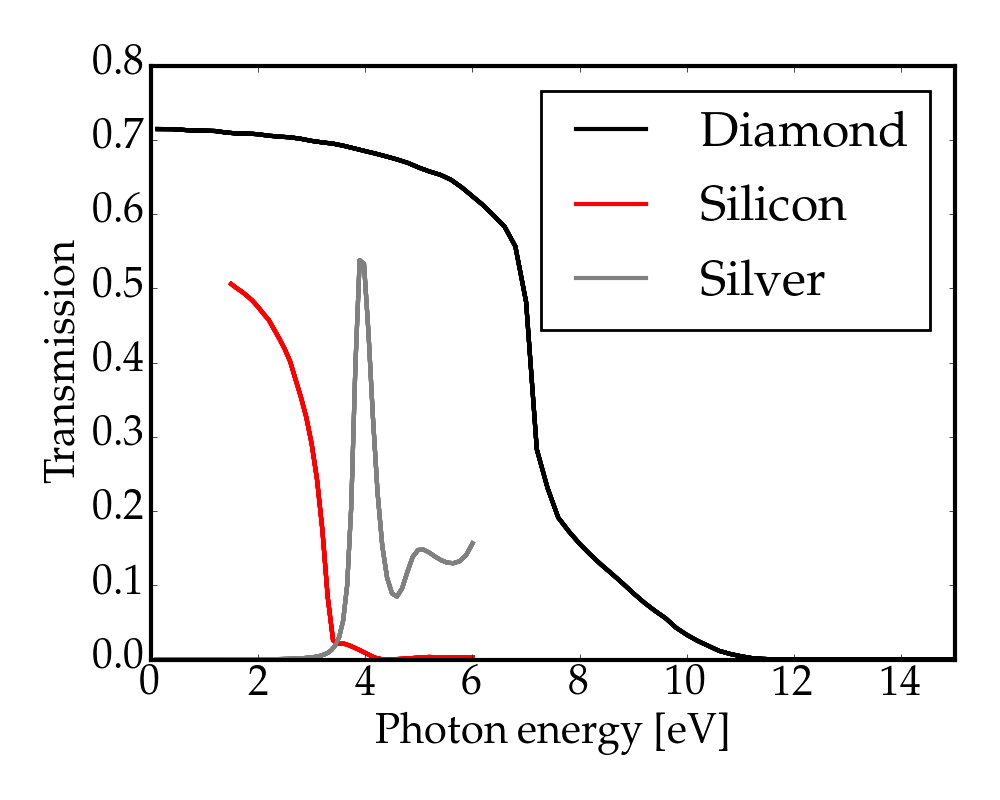
How can one qualitatively distinguish between the transmission spectra of a metal, a semiconductor and an insulator which are all drawn on the same graph (transmittivity vs wavelength)?
1 Answer
This strongly depends on the wavelength range you want to measure. E.g. x-ray transmission is qualitatively very different to the visible or IR range. In the visible range they should be extremely easy to distinguish.
Semiconductors and insulators cannot absorb light which has a photon energy below their bandgap. The transmission below the bandgap will consequently be very high. The only loss that occurs is the reflection of light at the surfaces, which is given by the real part of the refractive index. Therefore the transmission does not depend on the thickness of the sample below the bandgap. Above the bandgap a strong increase in absorption and a reduction of transmission occurs. You can distingiush a semiconductor and insulator by the energy of the bandgap, i.e. onset of absorption.
A metal on the other hand will transmit very little light in the whole visible range and will start to transmit more in the UV range.
In this figure you can nicely see the properties described above. Diamond is an insulator with a high bandgap, silicon a semiconductor with a low band gap and silver is a metal with no transmission below 3 eV. All three spectra are for a thickness of 20 nm.
