5
$\begingroup$

The question in the title is perhaps vaguely posed, so I'll include the concrete example which is bugging me.

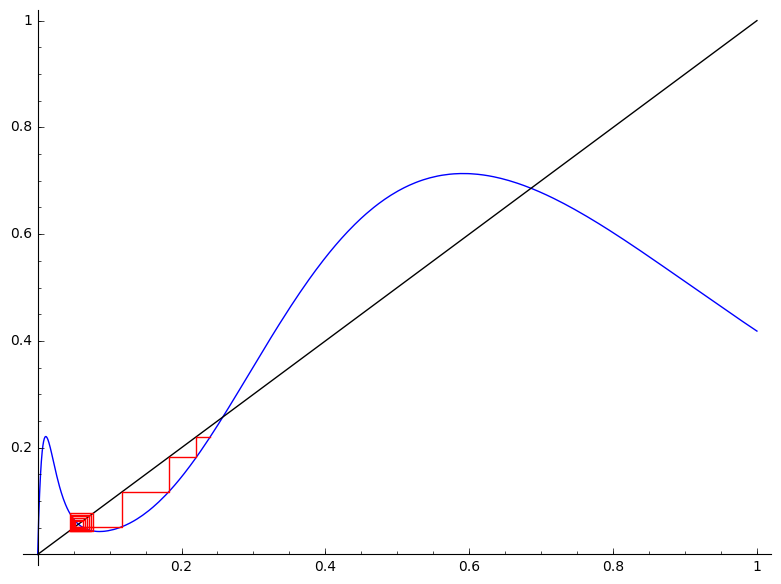
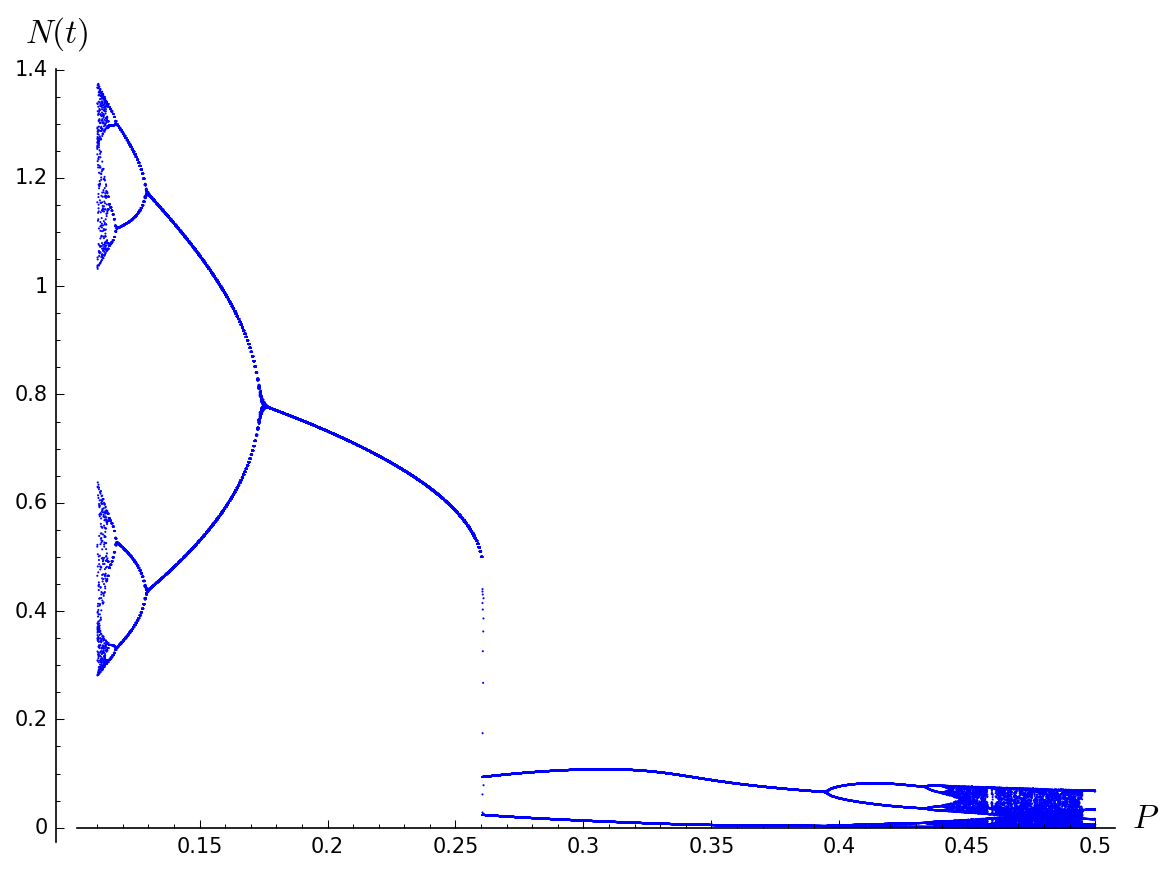
Suppose we have a mapping given by $$N_{t+1}=N_t\cdot \exp(r(1-N_t-PN_t/(\alpha^2+N_t^2))),$$ where $\alpha$ and $r$ are some fixed constants. If we plot this nonlinear mapping, we get something like this (plotted for $r=0.35, \alpha=0.1$ and, from top to bottom, $P_1=0.165, P_2=0.235, P_3=0.35$). The blue line corresponds to $N_{t+1}=N_t$

Graph 1

From here it can be seen that there are 3 regimes the system can be in, depending on the value of the parameter $P$:

  • For low values of $P$, the system has 2 fixed points (shown at 0 and at cca. 0.8)
  • For medium values of $P$, the system has 4 fixed points (shown at 0, $A$,$B$ and $C$)
  • For high values of $P$, the system has 2 fixed points again (shown at 0 and at cca. 0.03).

I took the liberty of drawing cobweb diagrams for them all (except $N=0$, which seems to be an unstable fixed point for the given values), but I'll show just the ones important for my question:

  1. Case $P=0.235$, starting point $N_0<N_B$, 2048 iterations show that it's orbiting point $C$.

Graph 2

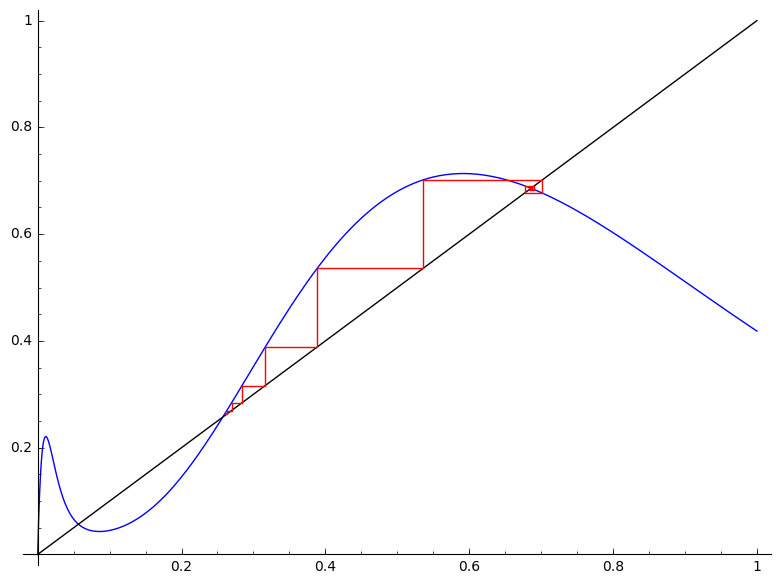
  1. Same case, this time the starting point is $N_0>N_B$ so the system tends towards point $A$, but much faster.

Graph 3

This seemed odd at first so I decided to plot the bifurcation diagram and the Lyapunov exponent of values of $P$:

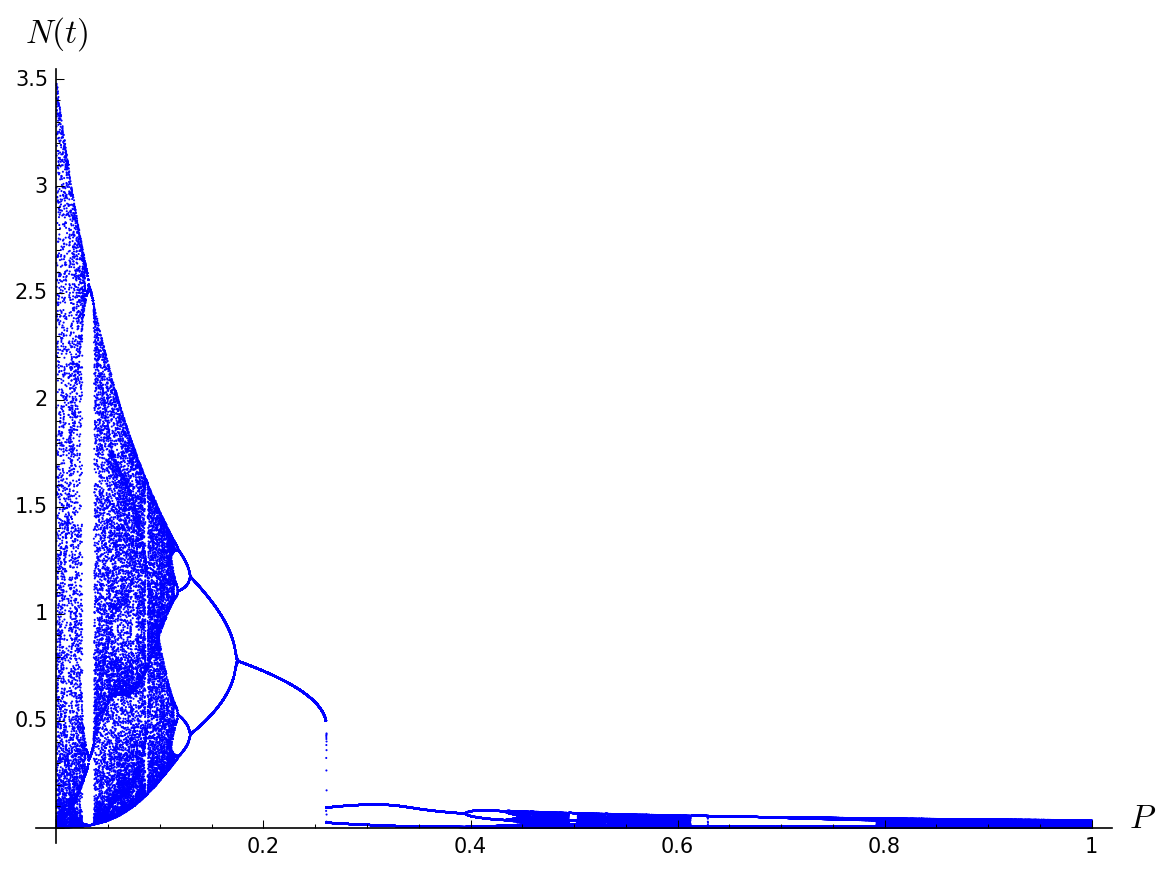
Bifurcation diagram (dots are pretty dense after $P=0.4$, so it's not as reliable for comparison with the Lyapunov exponent after that point):

Graph 4

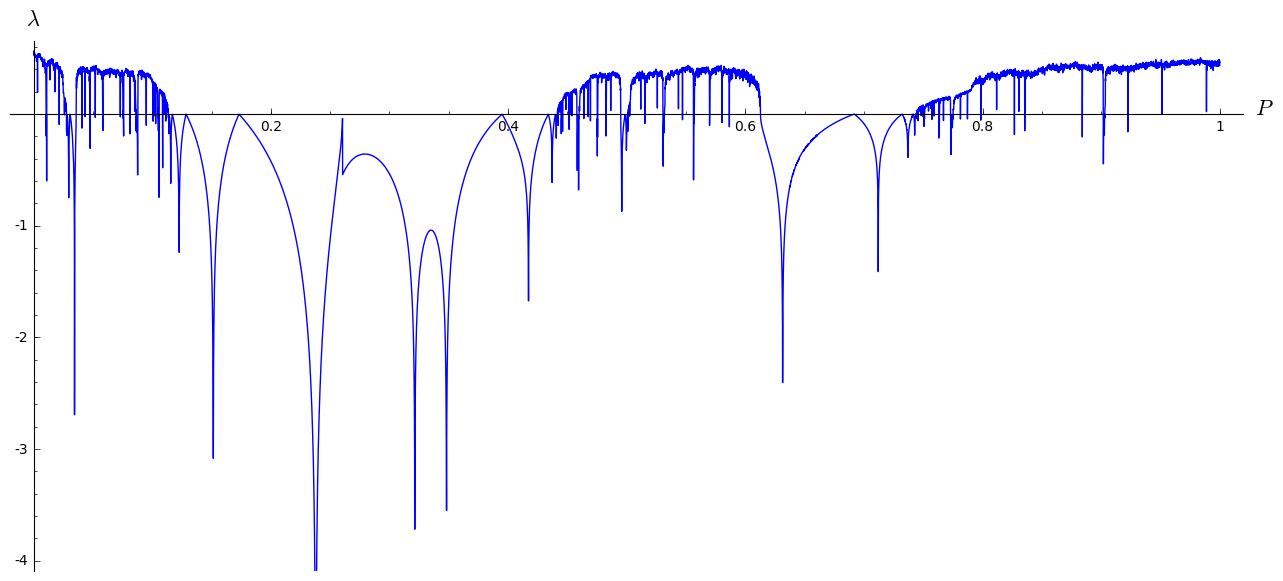
Lyapunov exponent:

Graph 5

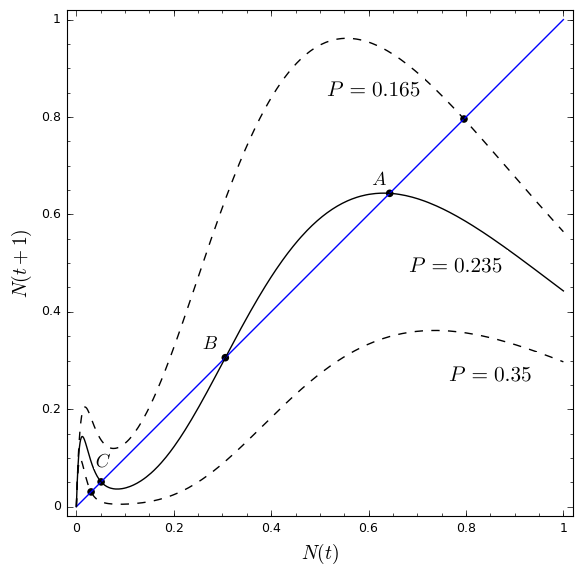
Most of the conclusions I made before drawing those last 2 diagrams got confirmed, but one issue stands: in the medium $P$ regime ($P=0.235$), the bifurcation diagram shows that the system has only one stable state (the higher one, point $A$), but refuses to acknowledge the other ($C$), despite the cobweb diagram showing that it's probably stable. Not only that, the Lyapunov exponent is around -2 for that point, and I'm pretty sure that the graph is accurate (it's plotted for the first 1000 terms in the Lyapunov sum, with a discrete step of 1/10000).

So, my main issue is: Does the bifurcation diagram show all equillibrium points that are accessible from a multitude of starting points for a given value of the bifurcation parameter? In this case, wheather the system landed in $A$ or $C$ depended only on the initial condition, namely $N_0<N_B$ or $N_0>N_B$.

For the doubled-period and chaotic regimes I got the correct cobweb diagrams (the system jumping between 2 distinct points and not settling in any point, respectively), among other correct predictions, so I'm convinced the error is not in my coding. Any insight in this matter would be greately appreciated.

EDIT: feel free to migrate this to math.se if you don't find this appropriate. The question arises from a physics problem, but I understand if it's considered off-topic

EDIT#2: As suggested, here is the enlarged version of the bifurcation diagram in the interval from $P=0.11$ to $P=0.5$

bifurcation enlarged

$\endgroup$
2
  • $\begingroup$ What kind of software or algorithm do you use for drawing the bifurcation diagram? This seems to be a numerical/interpretation problem. It would also be interesting to see the bifurcation diagram only from $P=0.25$ because the chaotic part for low P kinda steals the show. $\endgroup$
    – Void
    Commented Jan 26, 2016 at 20:29
  • $\begingroup$ Yes, it kind of is an interpretation problem, although it's possible that I don't understand the subject matter well enough. I drew all the graphs (including the bifurcation diagram) in Sage, an open-source symbolic programming package similar to python. If necessary, I can provide the code, but I don't think that will be necessary. I'll also append the bifurcation diagram for a smaller range to the question, thanks for pointing that out. $\endgroup$ Commented Jan 26, 2016 at 20:35

1 Answer 1

2
$\begingroup$

Ok, I do not know the Sage algorithm but I am going to offer a conjecture of what is happening. You have to verify the conjecture by further numerical investigations. I assume that the Sage algorithm works optimally for bifurcations of a single equilibrium and can run into problems such as we see here when dealing with equilibria (AKA fixed points) associated with more than one point.

What you see on your bifurcation diagram for $P > 0.26$ is actually a 2-point oscillation around the unstable equilibrium in $C$ (a basic bifurcation algorithm will not show unstable fixed points). The reason why this oscillation seems to converge on $C$ is probably because the oscillation is always very close to $C$.

At $P \approx 0.26$ the map-curve $N_{t+1}(N_t)$ touches the $N_{t+1}=N_t$ line, the equilibria $A$ and $B$ emerge as a "tangent bifurcation" for $P<0.26$ and this confuses the Sage algorithm to shift from the oscillation around $C$ to $A$. This confusion shows as the vertical line at $P \approx 0.26$ on your diagram. (Alternatively, there might be a short window of chaos.) Once again, the bifurcation diagram cannot show the unstable equilibrium $B$ which would show as a "lower branch" on the tangent bifurcation as seen for $P<0.26$. To verify this conjecture, you can check that at $P\approx 0.26$ both A and B emerge.

So the problem is probably that the Sage algorithm is trying to save computation time by only searching in the vicinity of the previous points on the bifurcation diagram but in so doing might omit parts of the diagram which are entirely due to a different equilibrium. To fix this problem you must simply set up Sage in a different way or use different software. (It is not difficult to write an inefficient but almost fail-safe program which draws the diagram just by shooting a bunch of densely placed random initial conditions and simply showing where they settle after a large number of iterations for every $P$.)

$\endgroup$
2
  • $\begingroup$ Nice answer. Your first two paragraphs are some of the conclusions I already made, but didn't include in the question, since I wanted to narrow down the topic. Still, it's reassuring to see similar thoughts from another person. Regarding the answer: currently I don't have time, but first thing in the morning I'm revising the plotting algorithm. I'm not really convinced that the problem lies there (my intuition tells me it's a conceptual issue, not a plotting error originating from the discontinuous arrival of a new equilibrium), but it's worth a shot. For now, +1 from me. $\endgroup$ Commented Jan 27, 2016 at 0:08
  • $\begingroup$ After a few years I returned to this question and concluded that your answer was correct - after doing some experimentation it turned out that point C is actually an unstable fixed point (with a stable orbit around it, but which doesn't show on the graph because of the simple algorithm). $\endgroup$ Commented Jul 13, 2020 at 1:37

Your Answer

By clicking “Post Your Answer”, you agree to our terms of service and acknowledge you have read our privacy policy.

Not the answer you're looking for? Browse other questions tagged or ask your own question.