1
$\begingroup$

Could someone help me understand the ideas behind setting confidence levels on decay lifetimes. Like what Super K has been doing on the proton.

Given the count rate of the decays is a poisson distribution, which has a standard deviation of the square root of the mean, are we somehow working out how large the mean would have to be to be far enough away that within a certain confidence level we would see no counts?

$\endgroup$

2 Answers 2

0
$\begingroup$

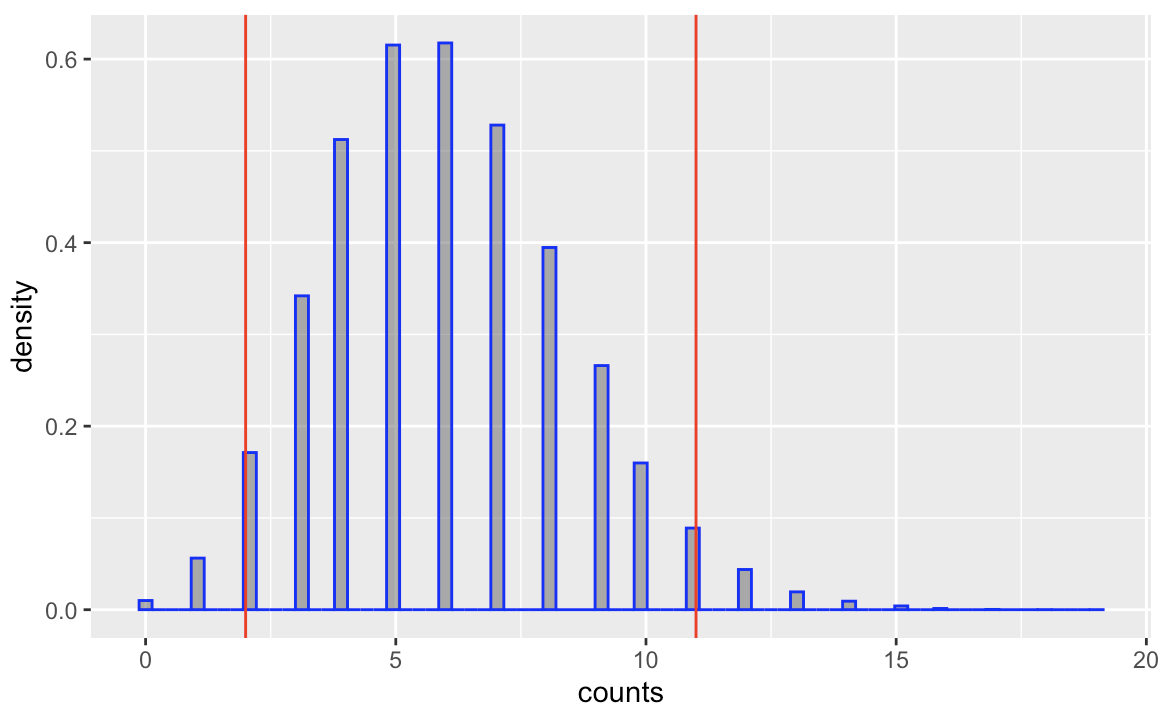
Suppose, the count rate of the decay process is a random variable $Y$, which is distributed as $Pois(\lambda)$. Because $\lambda$ is the decay rate, we know that on average we get $\mu_{counts} = \lambda \cdot \Delta t$ decays in an time interval $\Delta t$. However, as the process is random, we also expect that the count will not be exactly $\mu_{counts}$, but that it somewhat "scatters" around this value. Therefore, it makes sense to ask the following question: "Which is the minimal count and what is the maximal count which we expect to obtain in 95% of the cases?"

This question is answered by calculating the 95% confidence interval of the counts using $\lambda \pm 1.96 \sqrt{\lambda}$ -- where I assumed $\Delta t = 1$. For example, if we assume $\lambda=6$ this is what we get: enter image description here

If we perform an experiment the true rate $\lambda$ is unknown. Thus, we have to estimate the true value $\lambda$ from the dataset. This is the setting which we usually encounter, but the interpretation of the confidence interval is becomes "complicates". To read about the correct interpretation I recommend you google "confidence interval vs. credible interval". Here, I will only say that

  • The 95% confidence interval is not the probability that the true value of $\lambda$ lies within the interval.
  • The confidence interval is a statement about our expectation if we repeat the experiment: If we repeat the same experiment $n$ times, and each time we construct a 95% confidence interval, then we expect (in the long run) that 95% of our confidence intervals contain the population value.
  • The last point can be generalised: We don't have to repeat the same experiment, but we consider $n$ completely different confidence intervals -- e.g. the first is about the occurrence rate of the letter $n$ in english literature, the second is about the average income per house hold in the united state etc. If each study presents a 95 confidence interval (and if we assume that there exists no p-value hacking and no publication bias), then 95% of these confidence intervals should contain their true population value.
$\endgroup$
0
$\begingroup$

A sketch of the process might be as follows:

If you have some decay process with a an exponential decay timescale of $\tau$ and you set up an experiment that lasts $t$ seconds (where $t \ll \tau$), then the the number of decays you might expect to see is $$N_d \simeq \left(\frac{t}{\tau}\right)N_0\ , $$ where $N_0$ in this case would be the number of protons being monitored.

The statistics of the Possion distibution then tells you that the probability of detecting $n$ decays (assuming your experiment is perfect etc.) is given by $$P(n) = \frac{N_d^n}{n!}\exp(-N_d)$$ and if $n=0$, then $P(0) = \exp(-N_d)$.

Suppose then we want a 90% lower limit to what $\tau$ could be. We can say $$ 0.1 > \exp(-N_0\ t/\tau) $$ Taking natural log of both sides $$2.30 > N_0\ t/\tau$$ $$ \tau > 0.434\ N_0\ t\ . $$

Matsumoto et al. (2022) give results from "0.37 megaton years" of Kamiokande monitoring from proton decay. This is a water-based experiment, so I think this figure corresponds to $N_0 t = 3.9\times 10^{42}$ s.

Using the naive calculation above, the limit on $\tau$ would be $> 1.7 \times 10^{42}$ s.

The actual 90% limit quoted is $\sim 10^{41}$ s. The problem with the naive analysis is that it assumes there is nothing else going on in the experiment - particularly no "background events" unassociated with proton decay. In Kamiokande there is a (very low) background rate of a few detected counts due to neutrino interactions. So you are actually always detecting some decays, the question is whether there is an excess over those you expect due to a small number of background events. This reduces your experiment sensitivity and consequently the limits on the proton-decay lifetime. Secondly, the analysis above assumes all the proton decays could be detected, whereas in fact the estimate is that only 17% would be - which also reduces the naive lifetime limit by a factor of 5.

$\endgroup$

Your Answer

By clicking “Post Your Answer”, you agree to our terms of service and acknowledge you have read our privacy policy.

Not the answer you're looking for? Browse other questions tagged or ask your own question.