We had in our scriptum the following formula for the Bethe-Bloch formula:
$$-\frac{dE}{dx} = K\frac{\rho Z}{A} \frac{z^2}{\beta^2} \left[ \ln\left( \frac{2m\gamma^2\beta^2}{I} - \beta^2 \right) \right], $$
where I set $c = 1$ for convenience, $K$ is a constant, $I$ is the average ionisation potential, and $\rho$ denotes the density of the material.
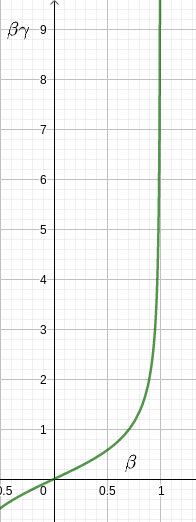
My question is: I have often seen plots which show on the $x$-axis $\beta\gamma$, but I am not sure how one would plot $-\frac{dE}{dx}$ as a function of $\beta\gamma$, given that in front of the $\ln$, we have the factor $\frac{1}{\beta^2}$ (and not $\frac{1}{\beta^2\gamma^2}$), and also in the $\ln$, we have $-\beta^2$ and not $-\left( \beta\gamma\right)^2$.
I would love hear some opinions on this!

