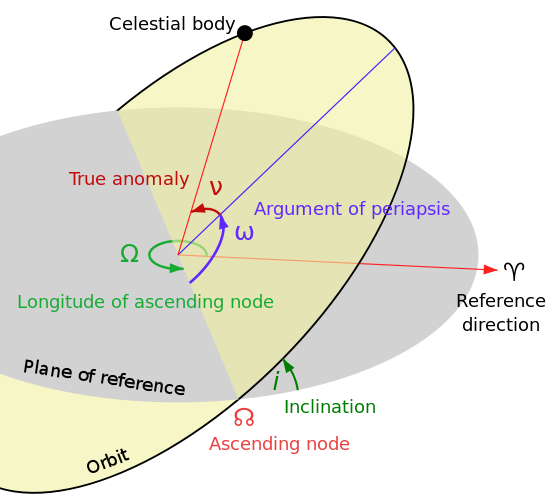
I am trying to project the ground path of an Elliptical orbit with an arbitrary inclination angle of $\Delta i$ and a period of $T$. I have all the parameters of the orbit (semi-major axis length, semi-minor axis length, eccentricity, apogee and perigee velocity, energy, etc.).
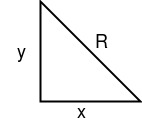
The approach I was taking was plotting a position of the satellite in the elliptical orbit on an X-Y plane. I iterate through the time domain $t \in [0,\textrm{T}]$ where T is the period of the orbit with a specified time step of $\Delta t$. For each time, I calculate the mean anomaly and the magnitude of the distance between the satellite and the center body, $r$. When projecting the position vector of the satellite with respect to the center body on the semi-major axis, the length of that projected vector will be defined as $x$. After finding $x$, I found the vertical projection of that same position vector, thus forming the triangle below.
First of all, I need to find mean anomaly as a function of time. My code is currently not working, but in theory what I am doing is (from Curtis's Orbital Mechanics for Engineering Students, 1st Edition) I am solving numerically for a quantity labeled as $E$ using the equation for mean anomaly (eqn. between 3.12 and 3.13 for those who have the book), given as: $M_e = E - e\sin(E)$. From there, I solve numerically for true anomaly using eqn. 3.7a:
$M_e = 2\arctan{(\sqrt{\frac{1-e}{1+e}}\tan{\theta/2})} - \frac{e\sqrt{1-e^2}\sin\theta}{1+e\cos\theta}$.
After finding those distances, I found the spherical coordinates of the satellite with respect to the center of the center body. $r$ would be $r_p + x$, $\phi$ would simply be the complement of $\Delta i$. $\theta$ would be the true anomaly.
After that, I plot (x,y) using spherical-cartesian transformation, but I simply do not believe that it is that straightforward. For one, what I am essentially trying to do is projecting a 3D curve onto a sphere and then projecting that onto a 2D plane. If anyone has sources/reading material on how to actually do this math, that would be fantastic. I was referencing this chapter from a book on satellites: http://fgg-web.fgg.uni-lj.si/~/mkuhar/Pouk/SG/Seminar/Vrste_tirnic_um_Zemljinih_sat/Orbit_and_Ground_Track_of_a_Satellite-Capderou2005.pdf. Unfortunately I cannot reference other equations that the book references until I get it.
I have not gotten the code to run yet, so I do not know what my plots look like but from preliminary data, it does not seem to be going in the right way (e.g. True anomaly ($\theta$) should be going from 0 to $2\pi$ as time increases, but that is not what is outputting.
EDIT: Typos and to clarify, I do not want to use external packages such as STK. I want to be able to physically come up with these plots.


