1
$\begingroup$

Often we come across 'decay topology' while doing data analysis in experimental particle physics. My guess is that it represents decay of a particle and how it decays and into what it decays.

Edit: I was reading about D*+ reconstruction and analysis strategy in a thesis by R S de Rooji (https://www.researchgate.net/publication/258809712_Prompt_D_production_in_proton-proton_and_lead-lead_collisions_measured_with_the_ALICE_experiment_at_the_CERN_Large_Hadron_Collider).

The exact lines were "... this chapter introduces the strategy for the $D^{*+}$ reconstruction via the $D^{*+}\rightarrow D^0 \pi^+_{soft} \rightarrow K^-\pi^+\pi^+_{soft}$ hadronic decay channel. Furthermore, the decay topology defines a multitude of observables on which can be cut in order to increase the statistical significance of the $D^{*+}$ signal compared to the combinatorial background which arises from uncorrelated pairs of tracks."

[decay=(of a radioactive substance, particle, etc.) undergo change to a different form by emitting radiation. topology=the way in which constituent parts are interrelated or arranged.]

$\endgroup$
0

1 Answer 1

4
$\begingroup$

This expression is used to describe patterns of decays, where the exact type of particles is not specified, as only the stages of the decay matters. Let's look at an example. The minimal supersymmetric extension has the following decay:

$$\begin{align} H&\to\tilde{\chi}^0_2\tilde{\chi}^0_2\\ \text{each}\ \tilde{\chi}^0_2&\to Z\tilde{\chi}^0_1. \end{align}$$

So a Higgs decays into two neutralinos (the next lightest ones), which in turn each decay into a $Z$ and the lightest neutralino $\tilde{\chi}^0_1$. Since $\tilde{\chi}^0_1$ is stable, this results in two instances of missing energy.

Then, let's consider this other example:

$$\begin{align} H&\to\tilde{l}^-\tilde{l}^+,\\ \tilde{l}^+&\to l^+\tilde{\chi}^0_1,\\ \tilde{l}^-&\to l^-\tilde{\chi}^0_1. \end{align}$$

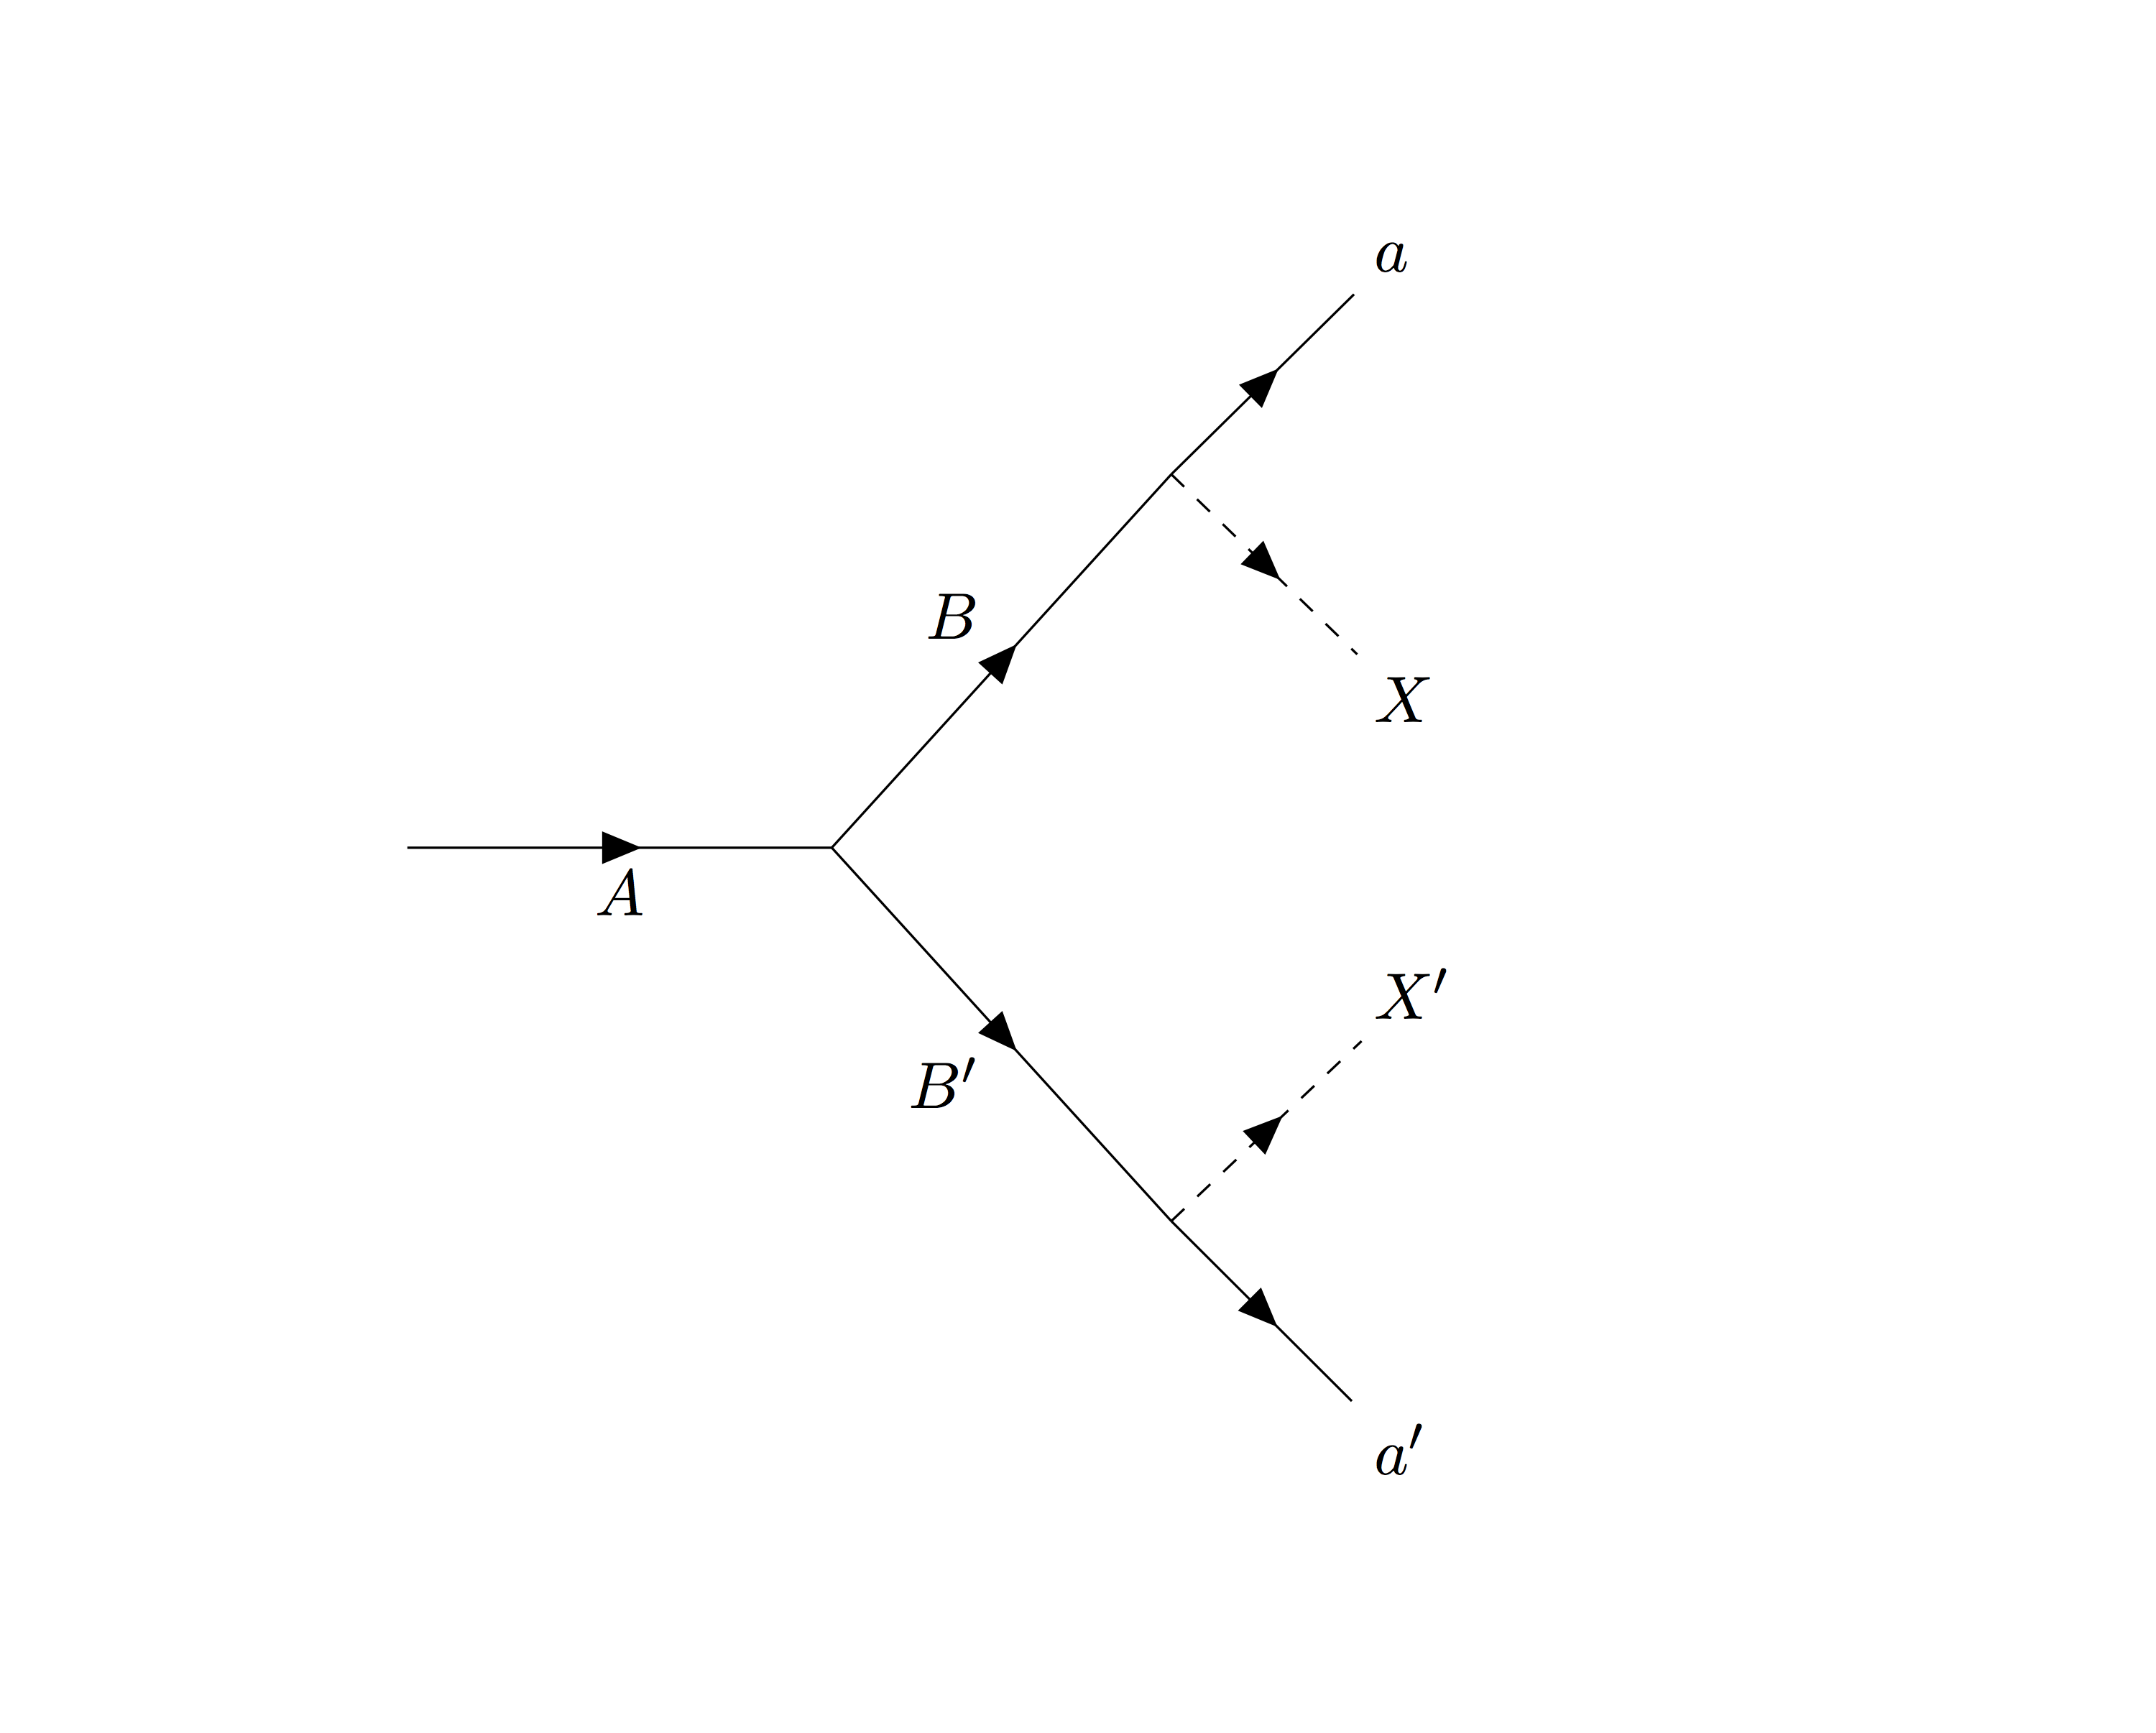
If we ignore the specific type of particles, both can be represented by the diagram below: with the assignment $A\to H$, $B,B'\to\tilde{\chi}^0_2$, $a,a'\to Z$, and $X,X'\to\tilde{\chi}^0_1$ for the first decay, and $A\to H$, $B\to\tilde{l}^-$, $B'\to\tilde{l}^+$, $a\to l^-$, $a'\to l^+$, and $X,X'\to\tilde{\chi}^0_1$ for the second decay.

Although this diagram looks like it, this is not a Feynman diagram: the arrows represent the flow of time and the dashed lines represent missing energy, i.e. the arrowed plain lines do not mean fermion and the dashed lines do not mean scalar. This is a decay topology, or more exactly a graphical representation of it. This allows particle physicist to study in one go a whole set of processes, which is especially useful for the reusing the kinematics computation.

enter image description here

$\endgroup$
2
  • $\begingroup$ also have a look at the usage of topology in clearing up channels as proposed here arxiv.org/abs/1110.6058 $\endgroup$
    – anna v
    Commented Sep 27, 2017 at 12:24
  • $\begingroup$ @annav 2011: when there was still hope! ;-) $\endgroup$
    – user154997
    Commented Sep 27, 2017 at 15:20

Your Answer

By clicking “Post Your Answer”, you agree to our terms of service and acknowledge you have read our privacy policy.

Not the answer you're looking for? Browse other questions tagged or ask your own question.