3
$\begingroup$

I try to get a clear understanding of FTIR spectroscopy and it is unclear to me what exactly the interferogram shows. I know that we see the intensity of the superpositioned beams where we vary the path length of one beam via a moveable mirror. But what kind of intensity do we talk about there? Is it the instantenious intensity or is it some time averaged intensity?

Is the moveable arm moved step by step and at each position the signal is averaged for this position to give one data point, Or does the arm continuously move and we measure a more or less continuous intensity signal as the arm moves?

An example of an FTIR interferogram, from here:

enter image description here

$\endgroup$
7
  • $\begingroup$ It's a good question in principle, but there's two questions here perhaps. 1) How does an FTIR spectrometer operate, and 2) what might average intensity and instantaneous intensity really mean in the context of experimental optical metrology? $\endgroup$
    – uhoh
    Commented Aug 4, 2017 at 8:13
  • 1
    $\begingroup$ My goal is to get step by step or rather question by question to the "how does an FTIR spectrometer operate". I thought that question would be to generalized. At the moment i would like to focus on the measured interferogram that is later on fourier transformed to obtain the spectrum. The inteferograms are often shown but it is not clearly stated what the y-axis so to say exactly shows. Intensity is quite a blurry term and should be further quantified in my opinion. The word intensity is sadly often used for different physical quantities but i want preferable in formulas exactly whats measured $\endgroup$
    – Hans Wurst
    Commented Aug 4, 2017 at 8:30
  • 1
    $\begingroup$ This picture shows exactly my problem! What is ment exactly with "Light measured by detector"? Can you give formulas based on incoming electromagnetic field that is superimposed at the detector? Is it the magnitude of the poyinting vector at the detector or the time averaged poynting vector magnitude ? $\endgroup$
    – Hans Wurst
    Commented Aug 4, 2017 at 8:32
  • $\begingroup$ Thanks for the clarification. Yes, we first learn about the intensity of a theoretically monochromatic beam of light as a simple time-average over one cycle. Then we have to un-learn that when starting down the rabbit hole where more complicated interference effects and concepts in statistical optics are studied (intensity interference, what the heck is that?). FTIR is as good a place as any to start thinking about this! $\endgroup$
    – uhoh
    Commented Aug 4, 2017 at 8:34
  • $\begingroup$ Might be worth a look newport.com/n/introduction-to-ftir-spectroscopy $\endgroup$
    – Alchimista
    Commented Aug 4, 2017 at 11:28

1 Answer 1

1
$\begingroup$

These are great questions, really getting to the point immediately!

FTIR Setup

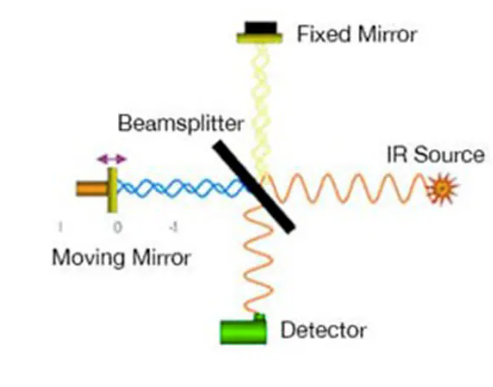
The detector receives a signal and outputs a voltage to the computer. Its material properties are known, allowing us to use the spectral response to determine its efficiency. A Michelson interferometer has two arms: one stationary and one movable. The moving arm changes the phase, which is then measured by the detector. Continuous and step scan modes (discrete case) generate the interferogram, representing the interference of the two beams recombining at the detector as a function of time. The Fourier transform of an interferogram (a function of time) yields the spectrum of the sample (a function of wavelength or frequency). The point in the middle (about 5.1 mm) is when the two arms of the Michelson interferometer are the same length, known as the zero path difference (ZPD). If you measure a sample and measure a background you can get the spectrum from the ratio of the two.

$\endgroup$

Your Answer

By clicking “Post Your Answer”, you agree to our terms of service and acknowledge you have read our privacy policy.

Not the answer you're looking for? Browse other questions tagged or ask your own question.