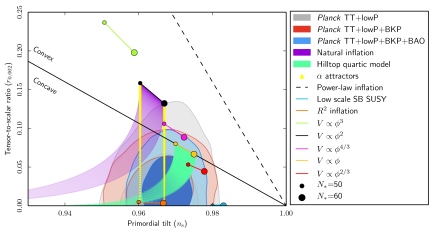
From a certain inflationary model I have obtained the theoretical values for the spectral indices $n_s$ and $r$ as functions of $N$, the e-folds number of inflation. At this point it would be interesting to compare my results with those of other models and observational results. Basically I want to achieve something like this:
Mainly I'm interested in the experimental results from Planck 2015. However, I don't know where to find the data on the Planck archive corresponding to the blue and red regions of the image I posted.
Can someone please explain me where to find the data and how to plot it?

