-1
$\begingroup$

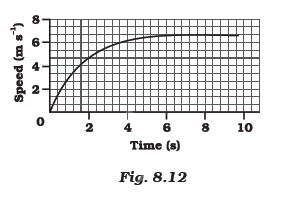
I am trying to find a formula that closely describes the speed of an accelerating car over time. I have found many graphs on the internet, but so far no formulae to generate them. For my purposes I will assume that the curve is continuous (i.e. no breaks or discontinuities for gear changes).

enter image description here

The example curve provided is not necessarily accurate, but it looks good. I want a formula that closely matches the acceleration of a real car. How can I calculate such a curve?

$\endgroup$
8
  • $\begingroup$ A function of the form of $c_1\tanh(c_2x)$ where $c_1$ and $c_2$ are constants seems to come close to the given curve $\endgroup$
    – Courage
    Commented Feb 1, 2016 at 3:54
  • $\begingroup$ @TheGhostOfPerdition Thanks! Do you know how well it matches real-world acceleration? All I know is that the curve in the image I found looks likely, not that it is actually accurate. $\endgroup$
    – CJ Dennis
    Commented Feb 1, 2016 at 3:57
  • 1
    $\begingroup$ @TheGhostOfPerdition What sort of drag function is used in the generation of the tanh relationship? $\endgroup$
    – Farcher
    Commented Feb 1, 2016 at 8:40
  • 1
    $\begingroup$ The simplest approach would be $\dot{v}=c-\beta v$ (constant accelerating force and a velocity dependent friction) or in simpler units $\dot{v}=1-v$ for which the solution is $v=1-\exp{-t}$, which is visually resembling to the plot. Edit Re Comment of @Farcher: differentiating tanh you see that a friction $v^2$ generates the tanh $\endgroup$
    – Bort
    Commented Feb 1, 2016 at 8:41
  • $\begingroup$ @Farcher I dint actually derive it, since OP is trying to find a function that closely resembles the curve, I just guessed $\tanh x$ would fit well, it seems to do so $\endgroup$
    – Courage
    Commented Feb 1, 2016 at 9:14

2 Answers 2

4
$\begingroup$

The equation for your curve is given by:

$$ \frac{dv}{dt} = \frac{F(v)}{m} $$

where $F(v)$ is the net force on the car, which is a function of the velocity. we solve the equation by integrating to get:

$$ \int \frac{dv}{F(v)} = \frac{t}{m} $$

The trouble is that the net force $F(v)$ is a complicated function that doesn't generally have a simple analytic form. The main contributions to $F(v)$ are:

  • the torque delivered by the car engine. This is a function of engine speed and the gear so the torque changes (discontinuously) as the car speed increases

  • the aerodynamic drag. This is approximately proportional to $v^2$, though only approximately.

  • the friction in the drive train. This is appoximately proportional to $v$, though once again only appoximately.

The point of all this is that there is no way to write down a simple equation for $v(t)$ as there are just too many variables that we don't know. When designing cars engineers experimentally measure all the different factors like drag and friction, and with these empirical figures they can do a good job of predicting the performance of the car. Since you don't have access to this data the best you can do is fit some form of curve. For example as a starting point you could assume the torque is constant and the aerodynamic drag is quadratic, in which case you'd get:

$$ F(v) = A - Bv^2 $$

For some constants $A$ and $B$, giving:

$$ \int \frac{dv}{A - Bv^2} = \frac{t}{m} $$

Integrating this gives:

$$ \tanh^{-1}(Cv) = Dt $$

or:

$$ v(t) = E\,\tanh(Ft) $$

where the uppercase letters are all constants that you have to fit numerically. I note that this is the same function suggested by TheGhostOfPerdition in a comment.

$\endgroup$
-1
$\begingroup$

In Excell:

Vmax * (1-1/(EXP(A*B(t)))) Where Vmax is the auto max speed. A is the time in seconds. B(t) is an equation which approximates the change in drag. You need 3 data points:

At time zero speed is 0 mph.

At time X speed is max speed.

At time Y speed is 60 mph.

Time data points must be sufficient to go from 0 to time for max speed. I used a very simple linear function for B(t) - starting with a value of .1 and adding .0038 for each .2 second time period. Adjust each parameter until the curve shows max speed at the end and when the curve goes through 60mph at the proper time.

Note: This is not an accurate method, but allows a simulation sufficient for velocity modeling for things such as a video game or chart in Excel. Your equation for change in drag may be based on time or better based on the speed (recursive/feedback).

This is just based on some curve fitting approaches I have used to approximate real life behavior. The more data points you have the more accurate you can match/predict real life behavior.

Note: This is for non-linear behavior based on the graph which was initially shown. Other plots can be curve fitted using other methods.

$\endgroup$
1
  • $\begingroup$ As it’s currently written, your answer is unclear. Please edit to add additional details that will help others understand how this addresses the question asked. You can find more information on how to write good answers in the help center. $\endgroup$
    – Community Bot
    Commented Feb 9 at 0:01

Your Answer

By clicking “Post Your Answer”, you agree to our terms of service and acknowledge you have read our privacy policy.

Not the answer you're looking for? Browse other questions tagged or ask your own question.