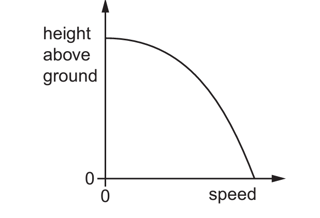
A ball is dropped from rest and falls towards the ground. Air resistance is negligible. What is the graph that shows the variation with speed of the height of the ball above the ground?
Here's my intuition.
$$v^2=u^2+2as$$ $$v^2=2as$$ $$s=\frac{v^2}{2a}$$
Hence $s$ is proportional to $v^2$. The graph must be a quadratic relationship. Hence the graph should be upwards sloping from the origin.
However, this is obviously not the case as there is originally a height above the ground, and therefore there must be a y intercept. The answer scheme provides the following graph.
Why is the curve downwards sloping when I just derived a quadratic relationship as shown above? Have I done something wrong?
Edit: John's explanation is great. However I am still unclear why the parabola slopes downwards rather than upwards.
$$h_0+\frac{v^2}{2a}$$ Seems to be a positive parabola. So why is the graph the other way round? $a$ is inuitively positive too. So I cannot see why this produces a negative parabola shape.

