I think the the answer you linked, written by David K, does give a lot of physical insight, by essentially applying the method of images. The formula in the answer you cited gives the times between successive same-direction meetings. To understand where that comes from, it might be interesting to think through how to derive the times of all same-direction meetings, starting from David K's application of the method of images.
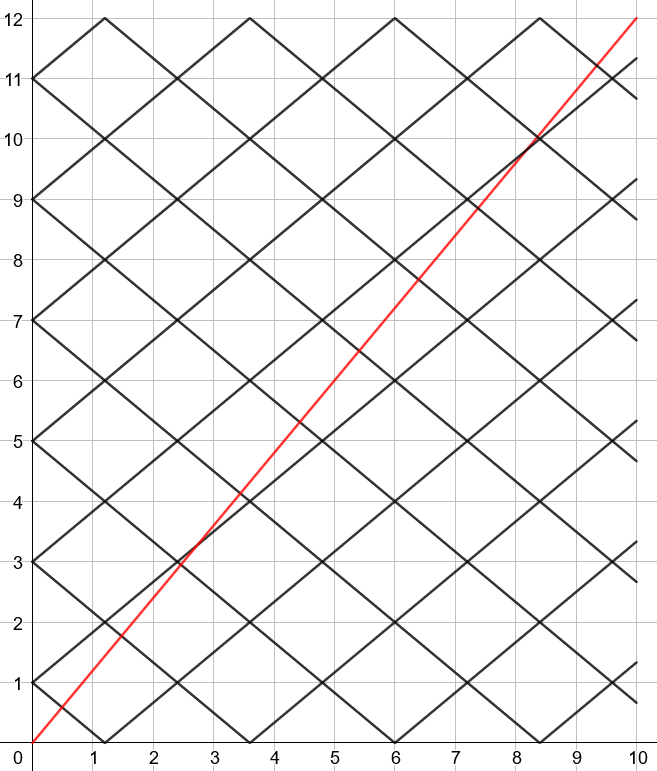
Let's look at the last figure produced in the answer by David K, which I think is quite helpful.

The "same direction" intersections will occur when the red line crosses a positive sloping black line.
We will assume $v_1 > v_2$, so in this figure $v_1$ is the slope of the red line and $v_2$ is the slope of the black line.
The red line has the formula
\begin{equation}
x_1(t) = v_1 t
\end{equation}
The first positive sloping black line has the equation
\begin{equation}
x_{2, 1}(t) = d + v_2 t
\end{equation}
Setting $x_1(t) = x_{2, 1}(t)$ equal allows us to solve for $t_1$, the time of the first same-direction intersection
\begin{equation}
t_1 = \frac{d}{v_1 - v_2}
\end{equation}
As a numerical sanity check, note that in the units of the figure, $d=1$, $v_1=1.2$, and $v_2=0.83$, therefore $d/(v_1-v_2) \approx 2.7$, which seems to agree with where the red line intersects the first upward sloping black line. This value also aligns with the value $2.72$ hours in @James's table.
The next positive sloping black line has the equation
\begin{equation}
x_{2, 2}(t) = 3 d + v_2 t
\end{equation}
The reason that the second line starts at $3d$, instead of at $2d$, is due to the reflecting boundary condition. Cars separated by $2d$ are actually in the same location.
Solving for $t_2$, the time of the second same-direction intersection, yields
\begin{equation}
t_2 = \frac{3d}{v_1 - v_2}
\end{equation}
As a sanity check, using our values from before, we'd expect $t_2 \approx 3 / (1.2-0.83) \approx 8.1$, which again looks consistent with the graph. This value also aligns with the value $8.17$ hours in @James's table, given the level of precision to which we are working. (And adding more decimal places to $0.83333...$ makes the agreement better).
In general, the position of the $k$-th black line (where $k=1, 2, 3, \cdots$) is
\begin{equation}
x_{2, k} = (2k-1) d + v_2 t
\end{equation}
so the time of the $k$-th same-direction intersection $t_k$ will occur at time
\begin{equation}
t_k = \frac{(2k-1)d}{v_1 - v_2}
\end{equation}
Since $t_3 \approx 13.6 > 12$, there are only two same direction crossings in the first $12$ hours.
Note that, consistent with the answer you linked to,
\begin{equation}
t_k - t_{k-1} = \frac{2d}{v_1-v_2}
\end{equation}
One way to understand this is that due to the reflecting boundary condition, we need to space the "copies" of the original cars by a distance $2d$ along the y axis in the figure above.

