 I'm a high school student, and I am interested in fluid viscosity.
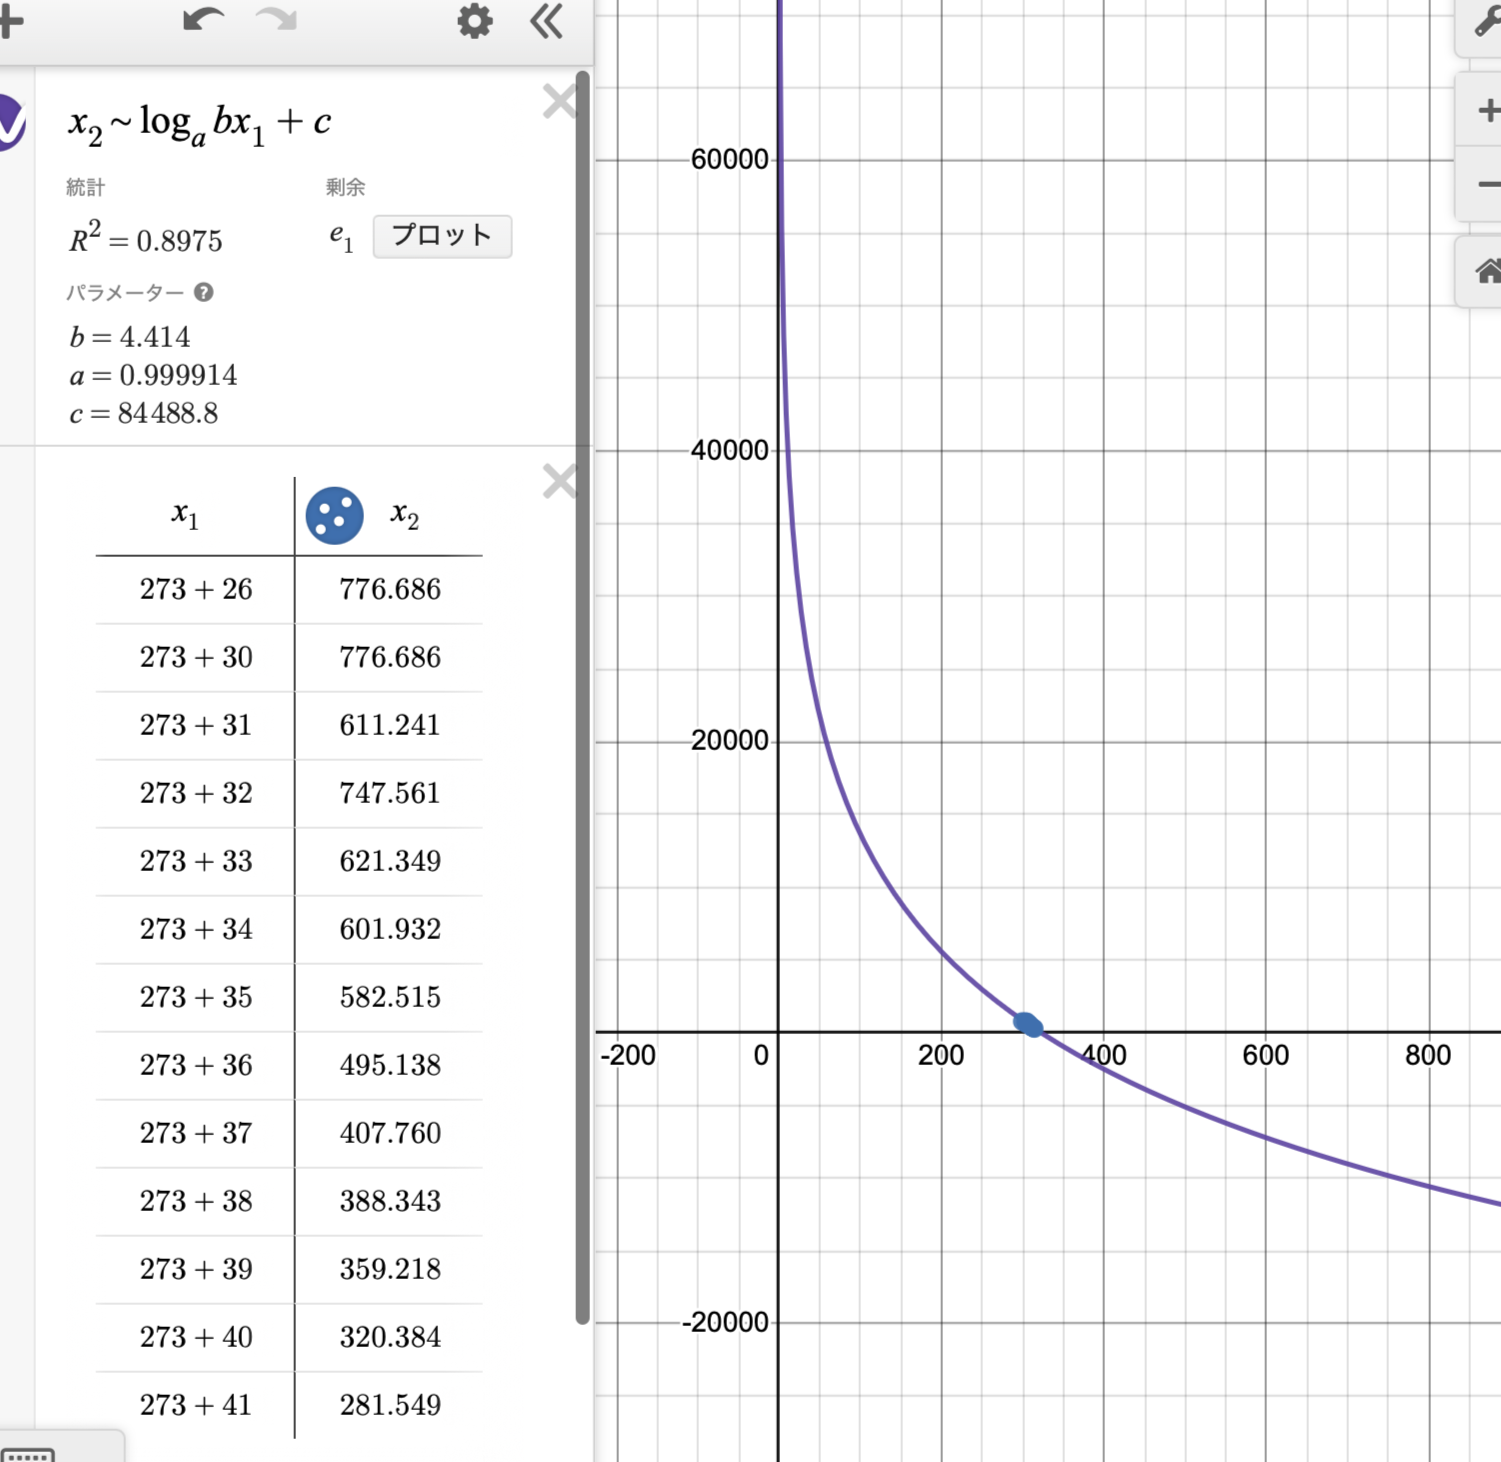
I was doing an experiment, and I got some data points. Following are some of them. Here,x1 is for temperature(in kelvin), and x2 is a viscosity(in pa/s).
Using these data, I was trying to figure out the specific equation representing all data points. Since I've seen many graphs of viscosity and temperature in curved form, I assumed that it would be a logarithmic graph. Here's my question.
Do I need more data points to correctly "assume(or predict)" the shape of the graph?
Is there any equation that can be used to express the relationship between viscosity and temperature?
