1
$\begingroup$

I have preformed the muon lifetime experiment at my uni's lab, and got the data. It's text file with 8190 numbers. My TDC unit was set so that the time gates were at 10 $\mu s$, and it has 8192 channels (first and last contained some kind of noise so they were not included in data analysis).

Now, I made a program in python that will sum every n data, and make a new list that I can then plot in bar plots and from that calculate the mean muon lifetime, because it decays by exponential law.

I also found that I can estimate the muon lifetime by using this formula:

$$<t>=\frac{\sum\limits_{i=n_l}^{n_u}N_i t_i}{\sum\limits_{i=n_l}^{n_u}N_i},$$

where $N_i$ is the number of counts in the bin, $t_i$ is the 'time bin', and the bins go from $n_l$ (lower) to the $n_u$ (upper) bin.

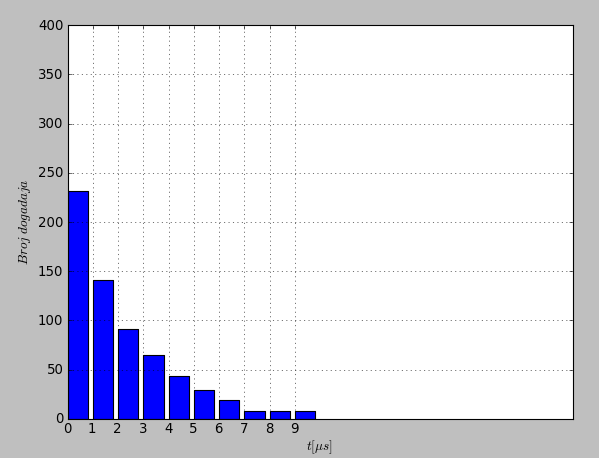
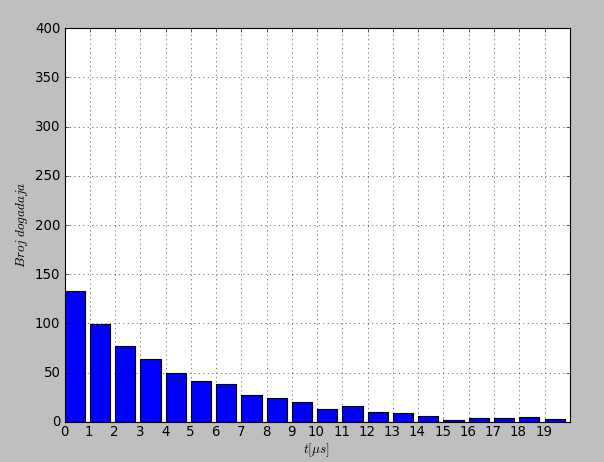
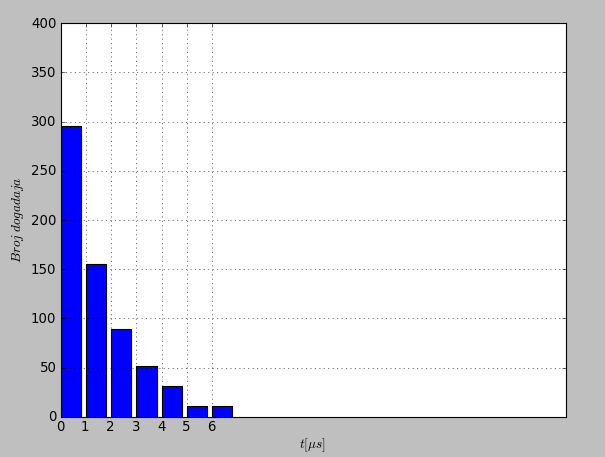
Using that as a guide, I found that for my data I get the best estimate if I set the bin count at 7 (7 bins), and if I put 10, I get higher result. Now if I set the bin number to 20, I get even higher number.

But that sounds wrong. I mean, there must be some kind of catch. If I divide the time I get for 20 bins by two I get the correct result (~2.5 $\mu s$).

The pictures are like this:
enter image description here

enter image description here

enter image description here

So what am I doing wrong with interpreting this?

$\endgroup$
5
  • 1
    $\begingroup$ Your "x" axis so far is just counting the bins. You have to convert it to "time intervals", and this conversion does of course depend on the number of bins. $\endgroup$
    – Lagerbaer
    Commented May 17, 2013 at 14:20
  • $\begingroup$ "and got the data. It's text file with 8190 numbers" You really, really should say what the data represents! If you don't understand that, then you don't understand the experiment. $\endgroup$ Commented May 17, 2013 at 15:11
  • $\begingroup$ Well it's just the count of muons that decayed within the scintillation detector in a period of the measurement. Now I don't really know how long did they left it running, since we only set it up as a lab exercise, and then they sent us the data. $\endgroup$
    – dingo_d
    Commented May 17, 2013 at 15:16
  • $\begingroup$ You do know how long ... you said the TDC intervals were $10\ \mu s$ each, and you choose how to group them. And @Lagerbaer is right because you want an answer in time units you should have the data in time units. $\endgroup$ Commented May 17, 2013 at 16:13
  • $\begingroup$ Oh, so basically I always have 10$\mu s$ because of my TDC, and always have to scale my bins accordingly. But that will also give me some change in mean life of muon. If I put 10 bins, I get $<t>=2.775193$ $\mu s$, for 20 bins $<t>=2.496124$ $\mu s$, and for 100 bins $<t>=2.297360$ $\mu s$. How to find the optimal bin division? By guessing? :\ $\endgroup$
    – dingo_d
    Commented May 18, 2013 at 6:52

1 Answer 1

3
$\begingroup$

There are at least two issues:

  1. @Lagerbaer's comment points out that that you have to convert the bin numbers into time intervals. The time for your experiment is already fixed, so if you use more bins, then each bin indicates a shorter time interval. The final bin in your third plot means a time twice as much as the final bin in your second plot, and three times as much as the final bin in your first plot. So when you fit your data for the half-life, you're actually getting the half-life in terms of bins. Correcting this might be as simple as multiplying by the width of each bin to convert the half-life from bins to $\mu\mathrm{s}$.

  2. To properly fit your data, you have to account for the uncertainty in your measurements. Each of your bins is a count or a count rate, and will have some uncertainty in that count or count rate. The decay of a particle follows Poisson statistics, where the uncertainty in the number of counts increases with the number of counts. But it increases more slowly, so the relative uncertainty goes down as your measured count rate goes up. Including the uncertainties in your analysis re-weights your bins according to their relative uncertainty. By leaving that out, you are inadvertently over-weighting the later bins. Over-weighting the later bins like that will give you a larger value for the half-life.

    One way to look at this is to look at bin 15 in your third plot. For an exponential decay, it should be less than bin 14, and greater than bin 16. But it's less than bin 16. That is a reflection of the counting statistics.

The weighting issue in point 2 is a subtle effect; I don't think it would double the half-life you get from your fit. The bin size in point 1 is much larger, and could account for an error of that size. You should correct that first. And depending on the level of the course, you might not even be expected to do the full uncertainty analysis.

$\endgroup$
3
  • $\begingroup$ So basically I would have to do something like t=10\mu s/8190 *n, where n is my bin number, if I got it right? That would be my 'gauge' sort of? Oh, and I was aware of the Poisson statistics, I planned to put error bars according to the count. If in first bin I have 150 events, then the error is $\sqrt{N}$, right? $\endgroup$
    – dingo_d
    Commented May 17, 2013 at 15:02
  • $\begingroup$ If I understood your description correctly, yes. You might need to use 8192 if that first and last channel were supposed to be actual data (and you dropped them because they were too noisy). But that's a tiny change. $\endgroup$ Commented May 17, 2013 at 15:06
  • $\begingroup$ My first chanel was like 40000, and last was 30 or so, but in between I had many 0, some 1 and 2. My professor said something about that first being the noise, and that I should disregard that. $\endgroup$
    – dingo_d
    Commented May 17, 2013 at 15:08

Your Answer

By clicking “Post Your Answer”, you agree to our terms of service and acknowledge you have read our privacy policy.

Not the answer you're looking for? Browse other questions tagged or ask your own question.