0
$\begingroup$

If I have a point charge q at the origin then the electric field will be
$$ \mathbf{E} = \frac{1}{4\pi\epsilon_0} \frac{q}{r^2} \hat r $$ that is to say that electric field will diminish by the square of distance as increase the distance from our point charge.
If we have a continuous surface charge in rectangular form with size very large then the electric field will be $$ \mathbf{E} = \frac{\sigma}{2\epsilon_0} \hat r $$ that is to say that electric field will be same everywhere.
But the problem comes when we go to Electromagnetic Waves, you see an EM wave is generally pictured as enter image description here which I think is a snapshot of the wave at some time t.
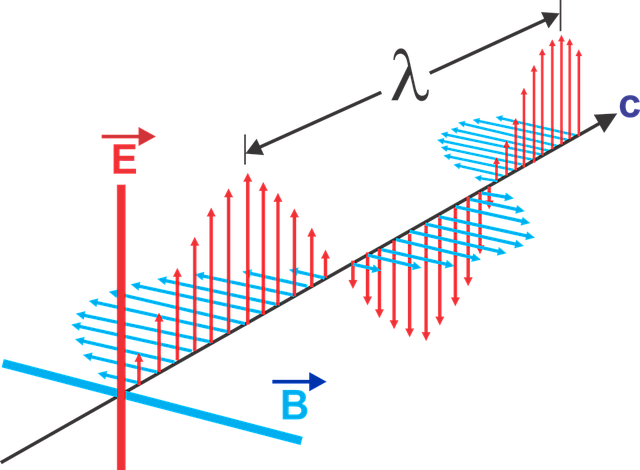
Now, my problem is: if we assume that red axis is our $x-$axis then you see our electric field is varying sinusoidally with this position $x$ at a particular time and I can't imagine how is it possible for an electric field to have a maximum value at some point and then have the same maximum value at some other point which is farther from the previous point? Actually I'm so used to the inverse square law that I'm not able to imagine the contradiction that how can field every increase with distance? It should diminish with as $\frac{1}{r^2}$ or as $\frac{1}{r}$ (in case of infinite line charge) or should not diminish at all (infinite surface charge). But I find this sinusoidal variation quite hard to imagine. I mean how can electric field ever increase with increase in distance (you see when those red arrows become sufficiently small they start rising up again).
Please provide me some illustration as in which condition electric field gonna vary sinusoidally?
Thank you, any help will be much appreciated.

$\endgroup$
3
  • 1
    $\begingroup$ The issue is that you are thinking about electrostatics, where the only relevant quantity is the electric field. EM waves don't exist in electrostatics, but electrodynamics (as in Maxwell's equations). $\endgroup$
    – user137661
    Commented Oct 17, 2019 at 15:47
  • 1
    $\begingroup$ The figure included here is making the rounds ... and it is incorrect if the arrow labeled "C" is the direction of propagation. With the E and B fields shown, the propagation would be in the opposite direction. $\endgroup$
    – garyp
    Commented Oct 17, 2019 at 16:37
  • 1
    $\begingroup$ @garyp You're right, but what's a negative sign but a cultural construct ... :P $\endgroup$
    – Bill N
    Commented Oct 17, 2019 at 17:16

2 Answers 2

1
$\begingroup$

The graph depicts the field of a plane wave, for which the amplitude does not vary with distance.

Plane waves are infinite in transverse extent (and longitudinal extent, for that matter), so they are unphysical, but they do describe the behavior of waves in volumes that are small enough that spatial variations can be ignored. Waves whose origin is a point source (or view the field very far from a compact source) obey the inverse square law. But if you take a small enough volume of the field of a point source, the field won't vary much with distance. It resembles a plane wave. The ideal plane wave is a model of such a situation.

$\endgroup$
10
  • $\begingroup$ Your second paragraph is clear to me but your first paragraph, when you said for which the amplitude doesn’t vary with time is not understandable by me @AaronStevens is trying to explain me that amplitude thing but I’m not able to understand it. I’m viewing that diagram as if the source charge is at the intersection of those red, blue and c axes and as I move along c-axis I’m moving farther and hence field should diminish even if the charge is vibrating sinusoidally. $\endgroup$
    – user240696
    Commented Oct 17, 2019 at 17:23
  • $\begingroup$ Your interpretation is not correct. The source cannot be at that intersection. The source must be a compact source very far away. A star would be a very good example. The amplitude here on earth does not change with distance very much at a distance of one million light years from the source. $\endgroup$
    – garyp
    Commented Oct 17, 2019 at 17:30
  • $\begingroup$ Yes. But why then there is wavy electric field shown in the picture of EM wave? What does that really convey? By the way thank you for your very clear explanations. $\endgroup$
    – user240696
    Commented Oct 17, 2019 at 17:33
  • $\begingroup$ The EM wave, like any other wave, has a wavelength. That's what's being displayed. $\endgroup$
    – garyp
    Commented Oct 17, 2019 at 17:40
  • $\begingroup$ Wavelength means distance between two crests, so what is the crest here? According to me the crest is the max amplitude of $E$ and that’s my problem why $E$ is fluctuating at all when you have said that $E$ wouldn’t change in small volume? $\endgroup$
    – user240696
    Commented Oct 17, 2019 at 17:49
0
$\begingroup$

The inverse-square law has very little to do with your graph. Like you said, it is a time snapshot of the EM wave showing the field strength and direction of a polarized wave at several points along the C axis. There is no depiction of what the E-field is along the red axis, i.e., the red axis is not a spatial dimension. Your graph is depicting only one spatial dimension. That's the source of your confusion, plus it's not static field from a point source.

$\endgroup$
8
  • $\begingroup$ Your graph is depicting only one spatial dimension . Will not electric field change as it is shown? Kindly explain me, I need it. $\endgroup$
    – user240696
    Commented Oct 17, 2019 at 16:09
  • $\begingroup$ @Knight Your picture shows vectors at points along the c-axis. Just because the arrows extend to above this axis does not mean the picture is showing the field at those points. Remember for a vector field a vector quantity is assigned to each point in space. In this diagram they have only shown the vectors at the points in space along the c-axis. $\endgroup$ Commented Oct 17, 2019 at 16:12
  • $\begingroup$ @Knight The lengths of the red arrows do not indicate position. They indicate the strength of the E-field at the C-axis location. Move to a different C-location and the E-field is different. $\endgroup$
    – Bill N
    Commented Oct 17, 2019 at 17:22
  • $\begingroup$ @BillN yes that’s only I’m saying. As we move along the c-axis the magnitude of electric field is increasing which is against the inverse square Law. $\endgroup$
    – user240696
    Commented Oct 17, 2019 at 17:27
  • $\begingroup$ @BillN I apologise for asking an off-topic question but can you please explain the thing in your about section. I mean I like to know how things $\int\vec{F}\cdot\vec{dr}$ $\endgroup$
    – user240696
    Commented Oct 17, 2019 at 17:32

Your Answer

By clicking “Post Your Answer”, you agree to our terms of service and acknowledge you have read our privacy policy.