0
$\begingroup$

Boyle's Law is defined as follows: $PV=k$

This implies that $P_{1}V_{1}=P_{2}V_{2}$ is true while temperature and mass of confined gas is constant.

This would mean that $P_{2}=P_{1}V_{1}/V_{2}$ where the starting state $P_{1}V_{1} = k$ is the constant starting state. So if $V_{2}$ increases, $P_{2}$ decreases in a linear fashion.

  1. Why does then the animation on top of Wiki page draw a curve and not a straight line?

https://en.wikipedia.org/wiki/Boyle%27s_law

Also - an example that I understand follows the definition of the law. Please tell me if it is true or false.

  1. Equal, high pressure is homogeneously applied to two different balloons - one small and one large. Both balloons shrink by same volume percentage.

Charles's Law is defined as follows: ${{V}{T}}=k$.

For constant pressure and mass it gives: $V_{1}/T_{1}=V_{2}/T_{2}$.

  1. Is it without numeric iteration possible, combining Charles's and Boyle's Law to calculate a change from state $V_{1},T_{1},P_{1}$ to $V_{x},T_{2},P_{2}$/ $V_{2},T_{x},P_{2}$/ $V_{2},T_{2},P_{x}$?
$\endgroup$
1

3 Answers 3

2
$\begingroup$

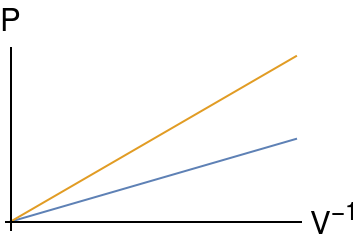
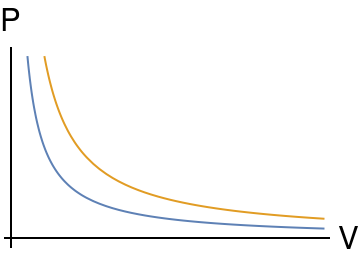
As you stated, Boyle's law says that $PV=k_1$ at constant temperature. This can be written as $$ P=\frac{k_1}{V}=k_1\,(V^{-1})\tag{1}$$ Thus, the plot of $P$ vs. $V^{-1}$ is a straight line with slope $k_1$. Moreover, it is also common to present the Boyle's law as a graph of $P$ and $V$. This means that, considering Eq. $(1)$, plotting $P$ vs. $V$ is like plotting a $y(x)=cx^{-1}$, and this is not a straight line. Examples for a gas at different temperatures are below, being the orange line at higher $T$:

For the second point, Charles' law is correctly stated as $ \frac{V}{T}=k_2$ (at constant pressure), because he observed that all gases expand approximately by the same relative amount between two temperatures, when studied at low pressures. If $t_C$ is the temperature measured in Celsius degree, this suggests that volume could be written as $$V=V_0\left(1+\frac{t_C}{273.15^\circ\text{C}}\right)\implies\Delta V=V-V_0=\left(\frac{\Delta t_C}{273.15^\circ\text{C}}\right)V_0$$ where $V_0$ is the volume of the gas at $t_C=0^\circ$C. Thus, a change in temperature from $0^\circ$C to $100^\circ$C induce an expansion of a gas in $36.6\%$ of its initial volume, whatever the gas and its temperature is. It has to be noted that this works fine for ideal gases only (i.e. low pressures or non-interacting gases).

Point 3. We want to take a gas at $(V_1,T_1,P_1)$ and change its state to $(V_x,T_2,P_2)$. For this, it would be possible to use Charles' law first and then Boyle's law, or vice versa. For instance, with Charles' law we have $(V_1,T_1,P_1)\to(V_x,T_2,P_1)$, via $$\frac{V_1}{T_1}=\frac{V_x}{T_2},$$ and with Boyle's law the change is $(V_x,T_2,P_1)\to(V_x,T_2,P_2)$, via $$V_xP_1=V_2P_2$$ Finally, combining these two equations (solving for $V_x$) we have the general $$\frac{V_1P_1}{T_1}=\frac{V_2P_2}{T_2}$$ This equation is used to calculate any change in one of those properties, fixing at least one.

For completion, if Avogadro's law is included, then we have the known ideal gas law $PV=nRT$.

$\endgroup$
1
$\begingroup$

If two things are inversely proportional to each other (like $P$ and $V$ in $PV=k$) you get a hyperbola when you make a plot with one of them on each axis. If two things are proportional to each other (like $V$ and $T$ in $V/T=k$) you get a line when you make a plot with one of them on each axis.

$\endgroup$
4
  • $\begingroup$ I could accept if you answer other questions as well and elaborate: both parameters are not changed at the same time, it should be = kx. $\endgroup$ Commented Jan 22, 2018 at 19:25
  • $\begingroup$ I don't yet understand what you're asking in your other questions. I also don't understand the second half of your comment. If you explain, I'll try to answer. $\endgroup$
    – Ben51
    Commented Jan 22, 2018 at 19:28
  • $\begingroup$ What you say on point 1 is true, but I can't understand why V=k/P and V1=P2V2/P1 do not form same cuve when P/P2 are altered. I have marked the other points I would like to understand by 2 and 3. $\endgroup$ Commented Jan 22, 2018 at 21:09
  • $\begingroup$ For number 2, the words appear correct, but the equation should be $V/T=k$ rather than $VT=k$. I don't follow your specification of the second state in number 3. $\endgroup$
    – Ben51
    Commented Jan 22, 2018 at 22:28
1
$\begingroup$

The graphs below shows three conventional ways of graphically presenting Boyle's law. As observed from the graphs below, the pressure increases with a decrease in volume, and vice versa. Pressure is inversely proportional to volume, so other parameters (temperature and amount of gas) are constant.

enter image description here

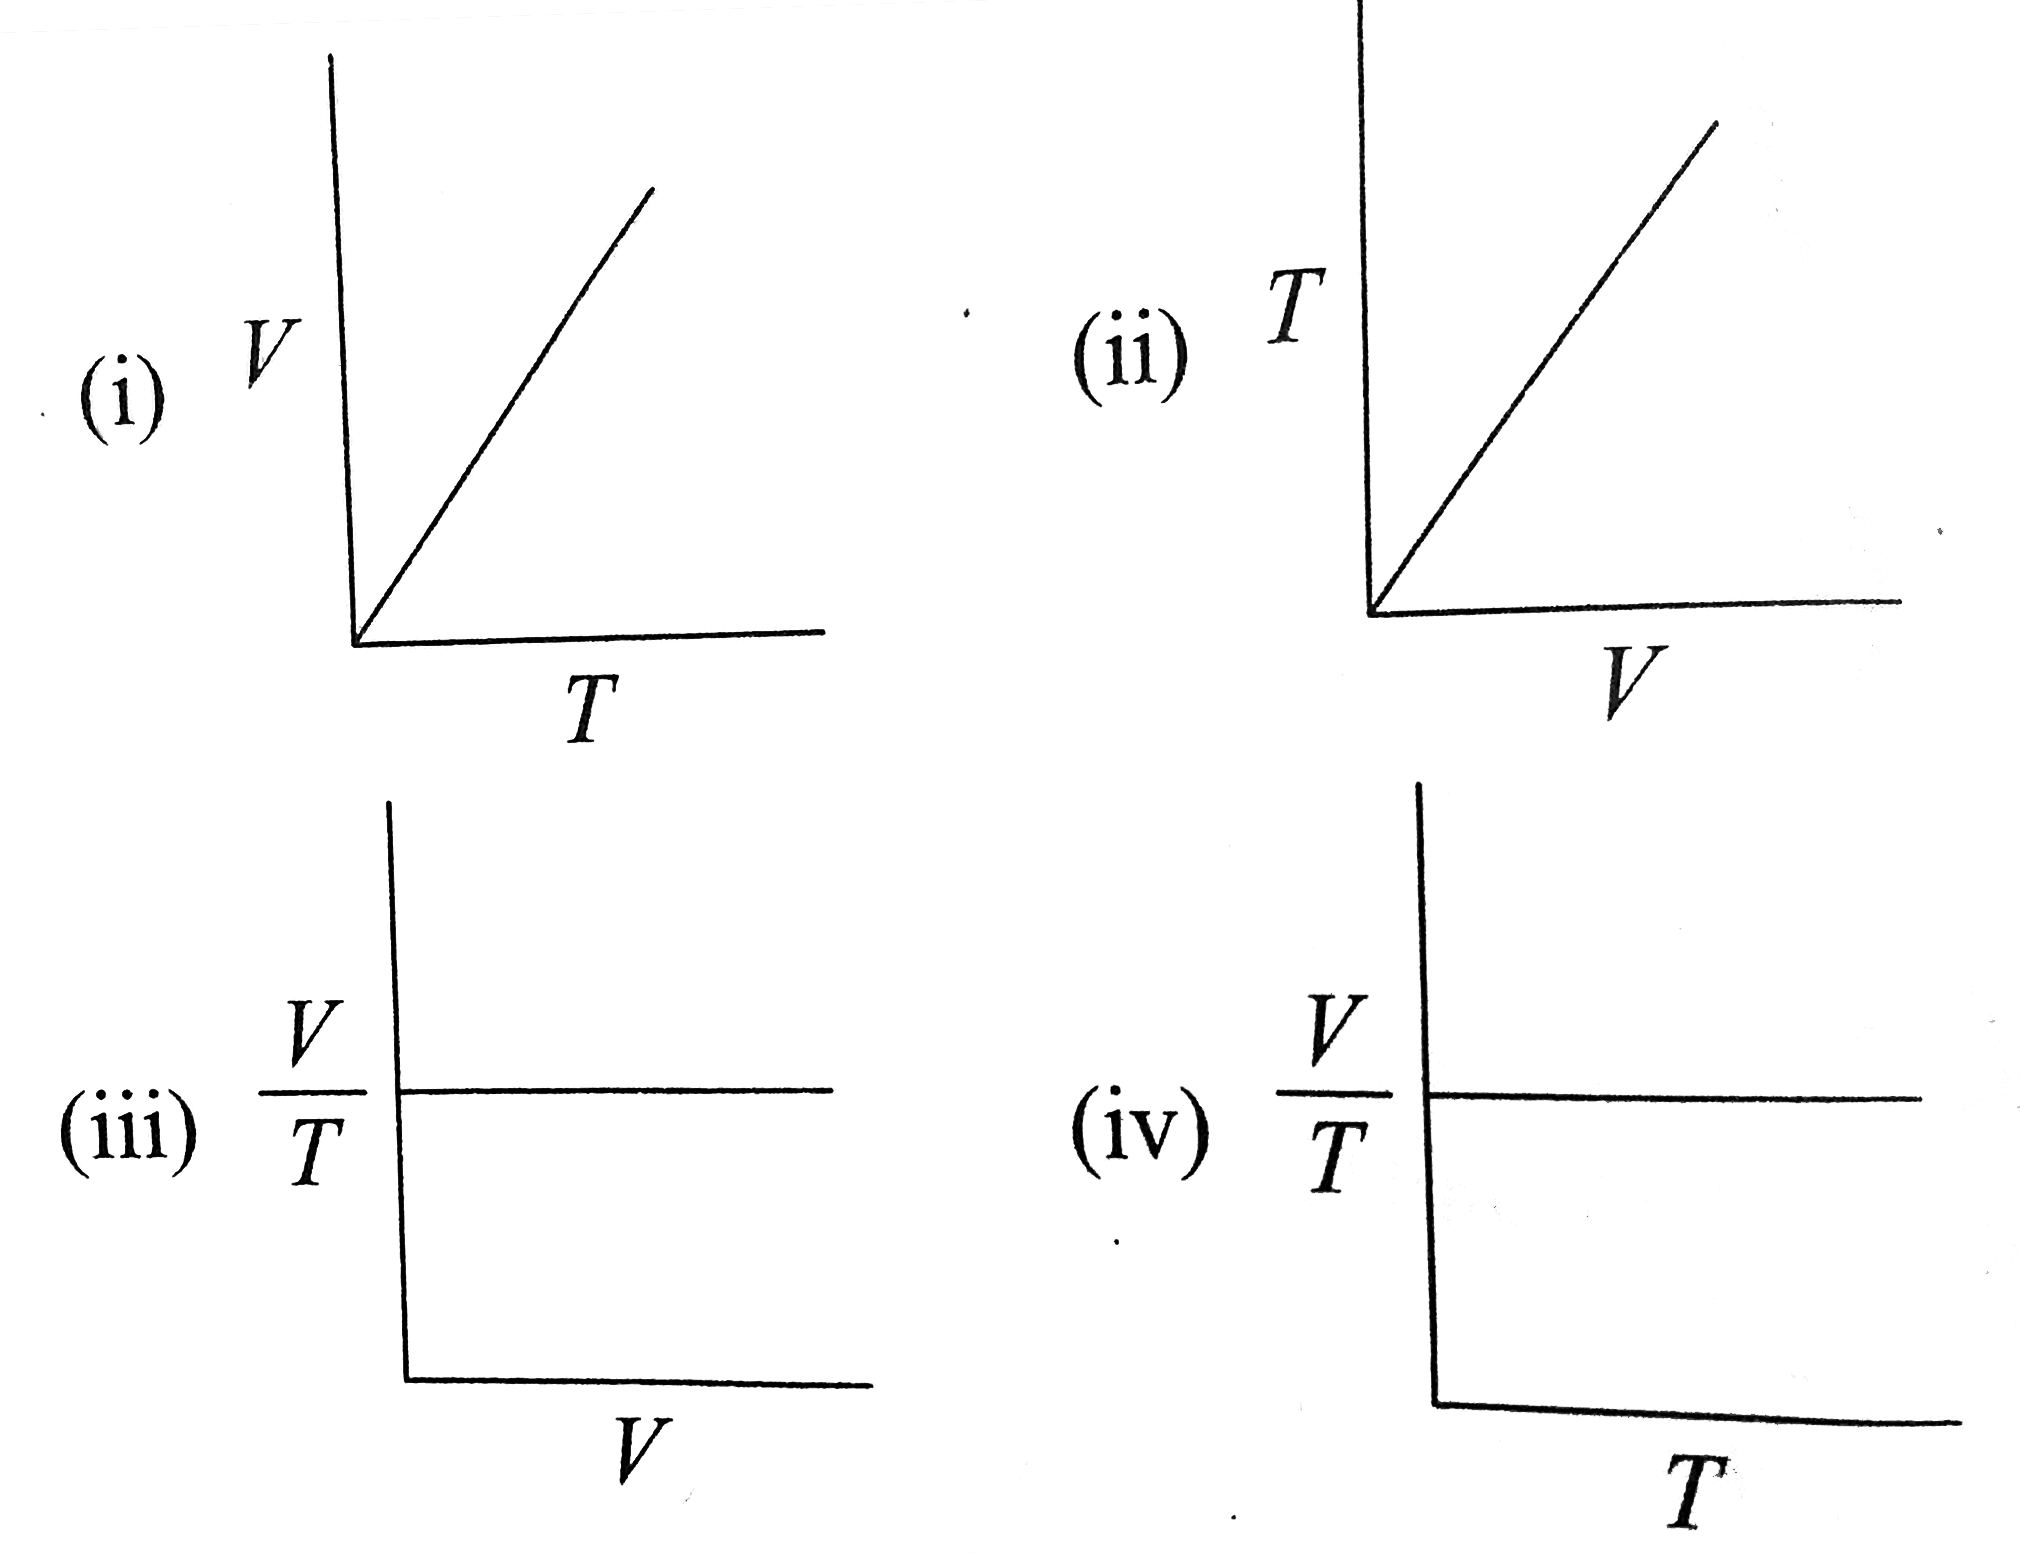
Charles's law states that the volume of a gas increases with the temperature, and vice versa. The graphs below shows four conventional ways of graphically presenting Charles's law. Volume is directly proportional to temperature at a constant pressure,

enter image description here

References

  1. "Graphs of Boyle's Law" ChemistryGod, 31st Oct 2019, https://chemistrygod.com/boyle-law-graph
  2. "Graphs of Charles's Law" ChemistryGod, 08th Nov 2019, https://chemistrygod.com/charles-law-graph
$\endgroup$

Your Answer

By clicking “Post Your Answer”, you agree to our terms of service and acknowledge you have read our privacy policy.

Not the answer you're looking for? Browse other questions tagged or ask your own question.