In order to define a scale of temperature we need to follow three steps:
- To choose a thermometric property which changes with temperature;
- To define two reference points;
- To define an interpolation.
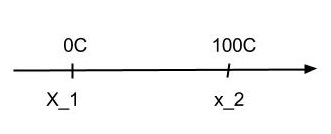
Actually, your question is related to the third step. Let us say we are controlling the volume of a portion of mercury. We define that when in thermal equilibrium with melting ice the volume $x_1$ of mercury corresponds to $0^oC$. Similarly at boiling water we define $x_2$ corresponding to $100^oC$. Then we choose to linearly interpolate the points between $x_1$ and $x_2$. We have something like the figure bellow:

where the intermediate temperatures grows linearly with the intermediate values between $x_1$ and $x_2$.
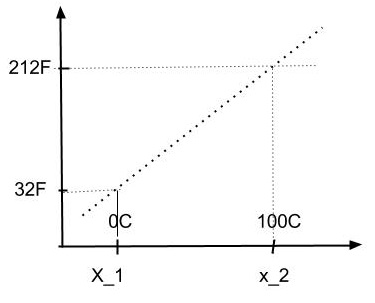
On the other hand, let us again consider the volume of mercury and let us associate (by definition) the volumes $x_1$ and $x_2$, at melting and boiling point, to the temperatures $32F$ and $212F$. Finally we decide to use linear interpolation again. Hence if we plot temperature in Fahrenheit versus volume we obtain a straight line (dotted line), i.e.,

As we can see, the dotted line, which is a straight line also provides a function between the abcissa (C or volume) and the ordinate (F). That is the temperatures in Fahrenheit and Celsius obey a linear relation,
$$T_F=A+BT_C.$$
Note that linear relations are valid between two scales as long as both have linear interpolations.


