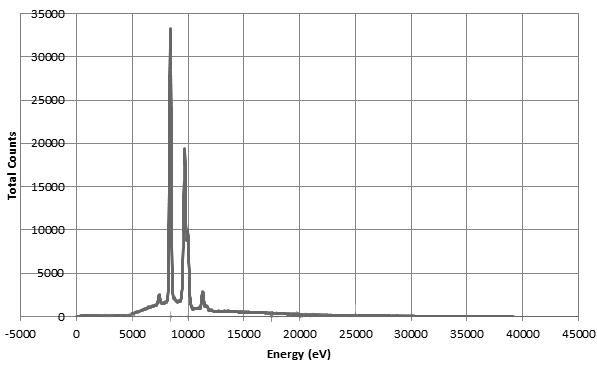
I have an X-ray tube which has the voltage potential from $4kV$ to $60kV$ and the target material is Tungsten $(W, Z=74)$. The emission spectrum provided by the manufacturer is given below:
The spectrum is measured directly out the end of the window using a SiPIN detector, energized to $40 kV /16.2 µA$, and integrated over $80$ seconds live time. The detector is approximately $8$ cm away from the tube, with a $1.6$ mm collimator immediately in front of the tube window, and a $0.1$ mm aperture immediately in front of the detector window. The space in between is open air.
It can be seen from the spectrum graph that there are Characteristic radiations involved in the form of sudden peaks besides the continuum that is due to the Bremsstrahlung radiation. The manufacturer has not provided the details regarding the spectrum behavior and I am trying to simulate the spectrum under same test conditions but my simulated spectrum shows no such peaks. Looking at the energies of those peaks (from the manufacturer's graph), it seems to be the L shell emissions $(L\alpha,$ $ L\beta)$ since the energies are in those range for Tungsten.
The simulation algorithm (TASMIP) that I have seems to model only the K shell emissions $(K\alpha,$ $ K\beta)$ which are beyond the peak energy of the test, i.e. $40keV$, and therefore absent. My simulations only have the Bremsstrahlung continuum, how do I simulate the L shell emissions so that it approximately matches the manufacturer's spectrum?

