0
$\begingroup$

For waves, the intensity pattern for the double-slit experiment is given by the following equation (as of David Morin's notes on waves)

$$ I(x) = I(0) \frac{D}{\sqrt{x^{2} + D^{2}}}cos^{2} \left ( \frac{x \pi d}{\lambda \sqrt{x^{2} + D^{2}}} \right ) $$

Where $D$ is the distance between the measuring apparatus and the slits' wall, $d$ is the distance between slits, $\lambda$ is the wavelength of the incident light, $x$ is the distance along the apparatus' wall and I(0) is the intensity at x = 0.

This equation yelds a graphic like enter image description here
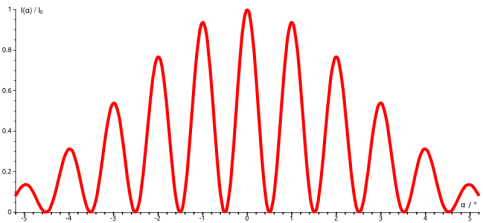
This result is widely proved in standard textbooks.

On the other hand, although most introductory quantum mechanics books start with the double-slit experiment, the standard procedure if to only affirm that the same experiment done with particles (or by checking through which slit does each photon goes through) has a shape like

[enter image description here2
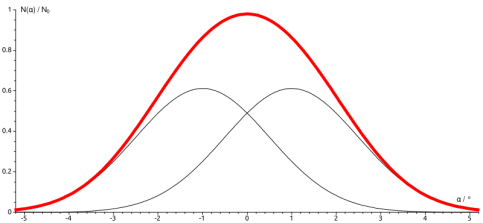
Where the black graphics would refere to having one or the other slit open, while the net result of having both slits open would be simply the red graphic, which is a simple sum of the black graphics. This is usully presented as an empirical result, without further details on the math behind it. In fact, I haven't found any book or articles that breaks down the math of this result.

My personal guess is that each of the black graphics represents a Gaussian, centered in the position in the $x$-axis of its corresponding slit. Even then, I am not sure of how to proceed for the particular of case of incident waves whose photons behave like particles, specially because many question can be opened around it:

How do these Gaussians vary with the total intensity of the incident wave? Do they depend of wavelength of each photon? How is the intensity of each photon measured? Etc.

My main goal was checking if the total area below the intensity's graphic doesn't change after collapsing the wave function (i.e. there is no net energy difference between the experiments). This is an impossible task without further details on the latter graphics.

$\endgroup$
14
  • $\begingroup$ Did anybody mention, yet, that many textbooks are a) not very good and that b) even the good ones are often misunderstood? Whether in your case a) or b) applies is a question that would have to be decided by comparing your statements with "most introductory textbooks", which is asking a bit too much, don't you think? How about you give us a citation of one textbook in particular that does this? $\endgroup$
    – CuriousOne
    Commented May 5, 2016 at 6:02
  • $\begingroup$ Two samples of textbooks that demonstrate the interference intensity pattern are the first section of this chapter of David Morin's notes on waves (I cited this on the question). Also, equation 8-22 of A.P. French's Vibrations and Waves is equivalent to equation 3 of the above link. From that, hitting the intensity formula presented in the question is a three-step procedure (shown in the above link). $\endgroup$ Commented May 5, 2016 at 6:17
  • $\begingroup$ Nevertheless, Feynman's collection is astonishing, but the math I required is nowhere in any of his books. $\endgroup$ Commented May 5, 2016 at 6:21
  • $\begingroup$ Did you look at figure 29 of Morin's chapter? $\endgroup$
    – CuriousOne
    Commented May 5, 2016 at 6:24
  • $\begingroup$ I hadn't, but, yet, that image referes to the measured intensity of the diffraction of a wave from a wide slit. I am asking for the measured intensity of the double-slit experiment done with particles. $\endgroup$ Commented May 5, 2016 at 6:28

1 Answer 1

2
$\begingroup$

It's unnecessary to check it for particular functional forms. After all, the functional forms aren't exact. In particular, it's not true that the intensity at all interference minima is strictly zero. The minima away from the center of the picture are closer to one of the slits, so the wave function from the slit is larger (in absolute value), and therefore can't be quite compensated by the smaller contribution from the other slit.

But the conservation of energy always works and one may see it e.g. in the limit in which the interference pattern is very dense. In that case, $\cos^2 x$ is quickly oscillating and its integral over any finite interval is the same as if the function is approximated by $1/2$, the average value of $\cos^2 x$.

One may also see that the which-way measurement doesn't affect the overall probability by proving the continuity equation – either for the probability using Schrödinger's current or the energy using the stress-energy tensor for Maxwell's equations

The difference between the interfering and non-interfering situations is exactly the mixed terms. The two amplitudes are $$ |c_1|^2+ |c_2|^2, \quad |c_1+c_2|^2 $$ and their difference (in the opposite order) is clearly $$ c_1^* c_2 + c_2^* c_1 $$ When you integrat these products, you will get the integral of a number with a fluctuating phase and the integral clearly vanishes at least approximately.

In fact, the vanishing is exact because e.g. the integral of $c_1^* c_2$ is nothing else than the Hilbert space inner products of the wave functions $c_1$ and $c_2$ describing the particle from the two slits. Those have to be orthogonal to each other exactly because the two options, two slits, are mutually exclusive. Eigenvectors of Hermitian operators are orthogonal and the "slit number" operator is a Hermitian one, too.

That's why the mixed terms integrate to zero and why the overall probability or the overall energy is not affect by the collapse after the which-way measurement.

$\endgroup$

Your Answer

By clicking “Post Your Answer”, you agree to our terms of service and acknowledge you have read our privacy policy.

Not the answer you're looking for? Browse other questions tagged or ask your own question.