2
$\begingroup$

EDIT:I would like to say thank you to those who have commented so far trying to help me. It is really appreciated!!

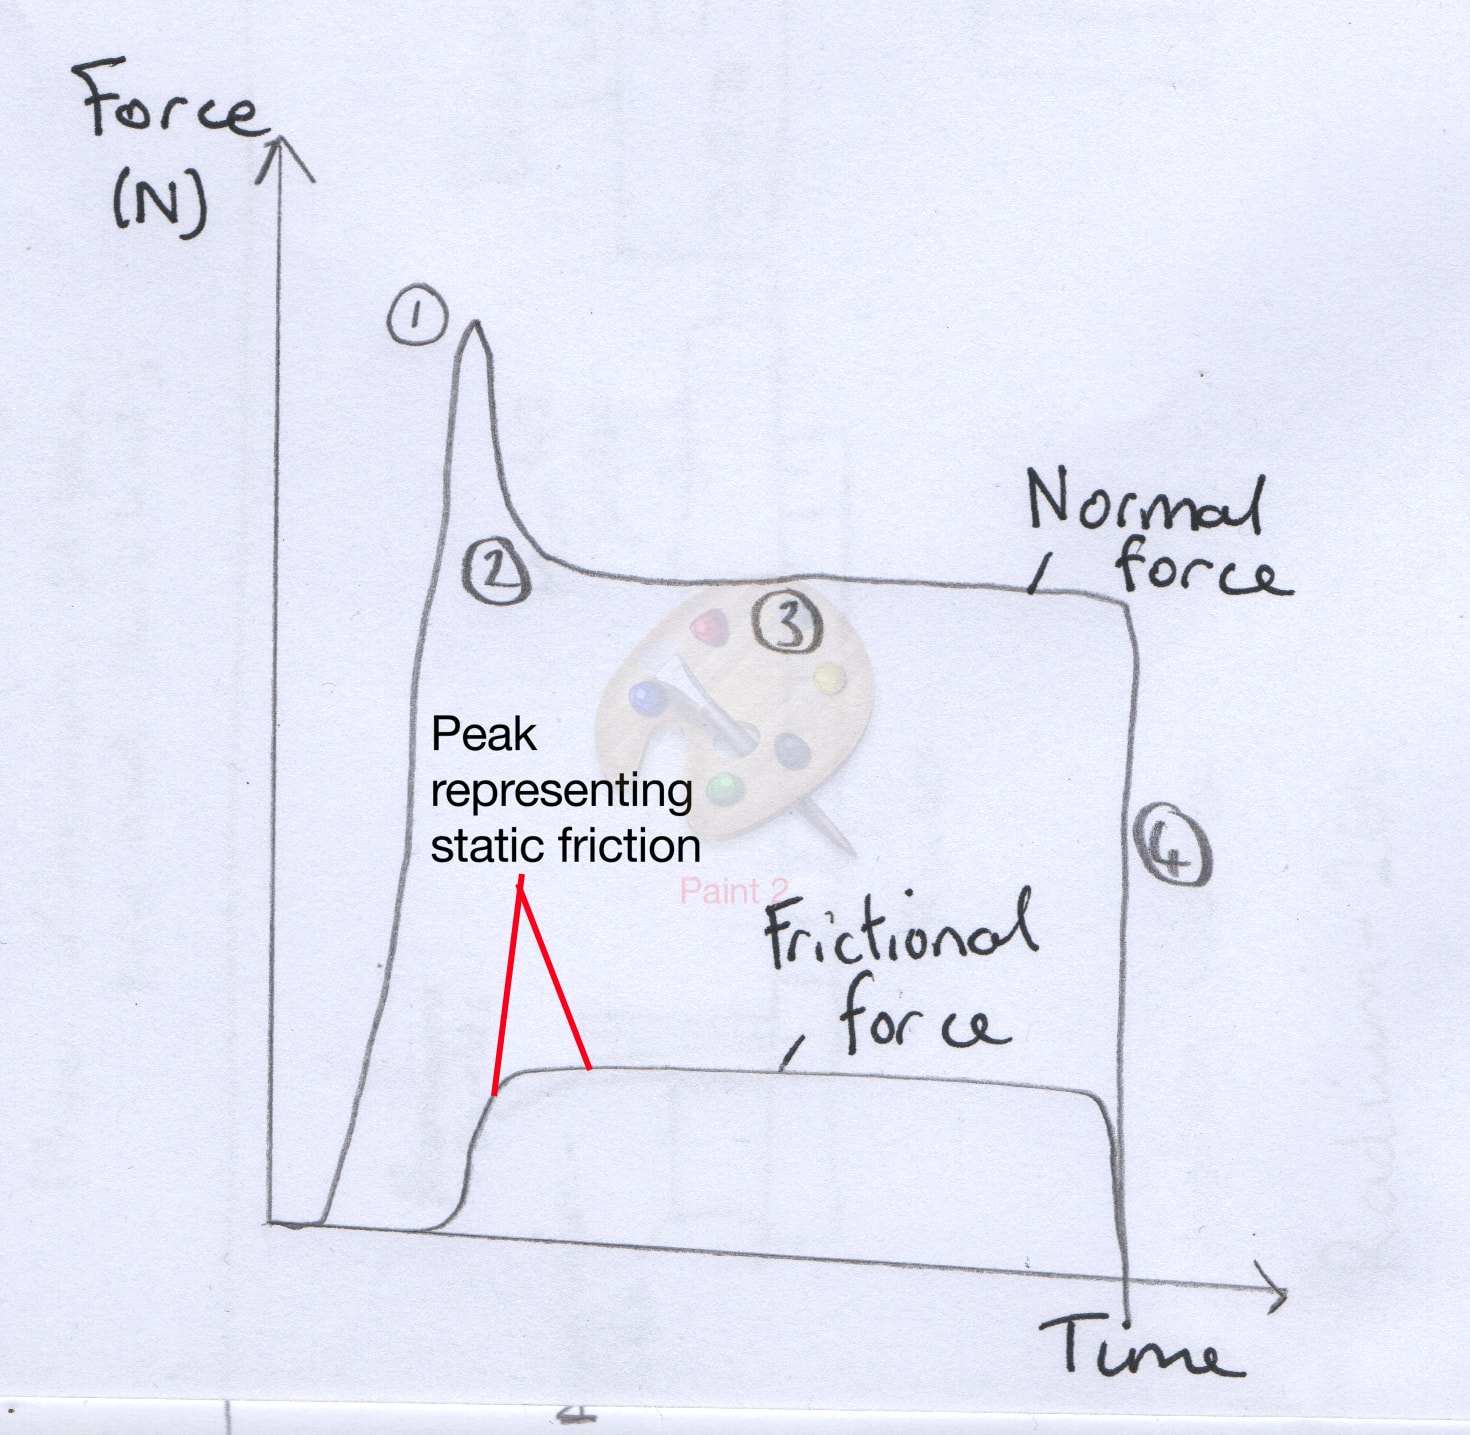
In a project, I am analysing the frictional behaviour of different specimen on a number of surfaces. I am trying to identify which specimen provides better grip (i.e. greater coefficient of static friction), however there is no peak in frictional force before the slip region which corresponds to static friction.

As such I am unable to determine the static friction coefficient and have uncertainty as to whether the slip region corresponds to dynamic friction or whether there is some other mechanism being exhibited, such as stick-slip friction.

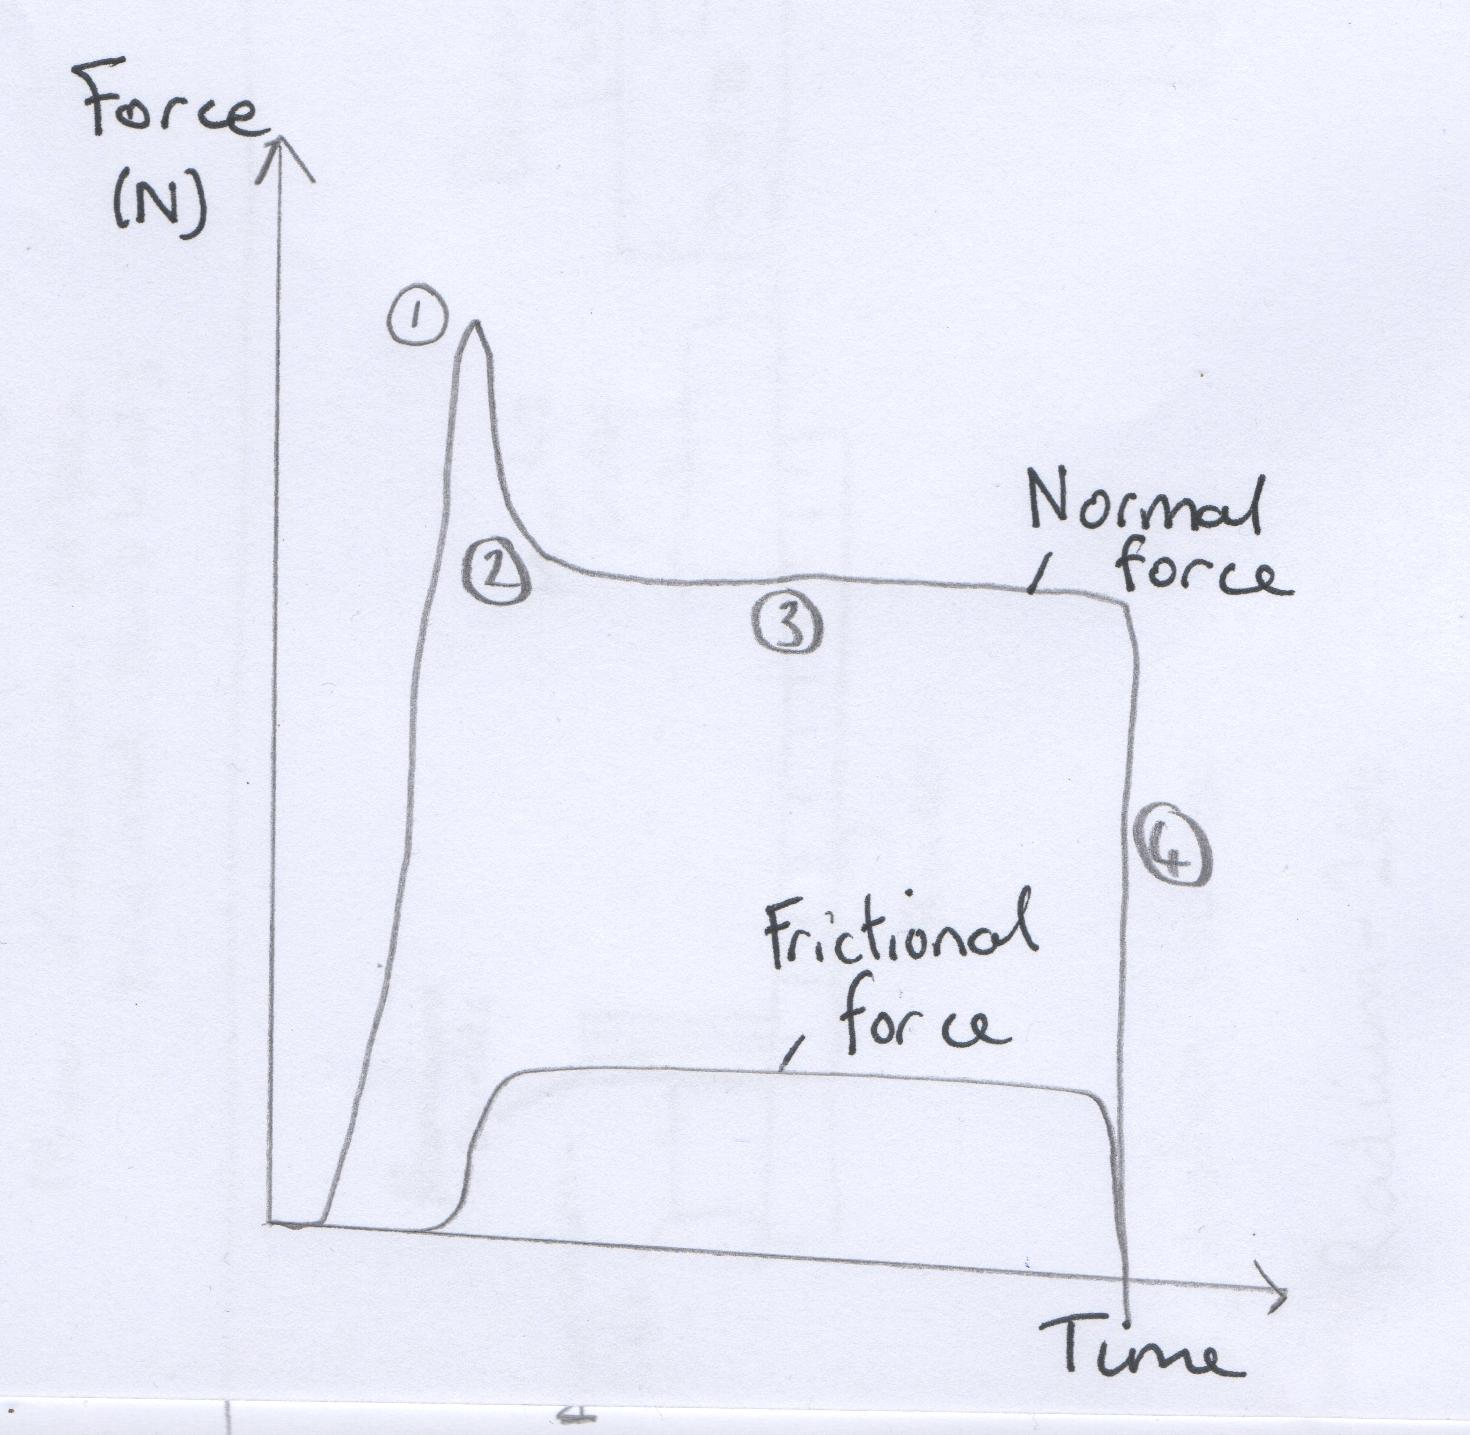
The attached picture shows the trend which is seen in every repeat (5 total for each surface) across 11 different surfaces (wood, metal, plastic, fabric etc).

The regions correspond to:

1) Specimen pressed down into contact with surface

2) specimen begins to move laterally

3) steady slip (?) region

4) Specimen lifted from surface

As can be seen, the friction coefficient (frictional force/normal force) is constant throughout the testing pretty much.

Can anyone offer any ideas as to why the results are coming out like this and what is possibly going on?

Many thanks

enter image description here

Here is the results I was expecting which gives me two definite regions where I can determine static and dynamic friction:

enter image description here

$\endgroup$
18
  • $\begingroup$ Why would friction change with time? Rather, friction would change with the force that pushed the object over the surface. See the first picture in hyperphysics.phy-astr.gsu.edu/hbase/frict2.html $\endgroup$
    – Steeven
    Commented Apr 27, 2016 at 14:21
  • $\begingroup$ [...] whether the slip region corresponds to dynamic friction or whether there is some other mechanism being exhibited, such as stick-slip friction. The "stick-slip" phenomenon is not a new kind of friction but merely a mix of dynamic (kinetic) and static friction. In general $\mu_s>\mu_k$, which may cause a small "jump" when the static friction limit is passed. This might lower the applied force momentarily - just enough for friction to fall below the static limit again. This repeats and is called "stick-slip" $\endgroup$
    – Steeven
    Commented Apr 27, 2016 at 14:27
  • $\begingroup$ The measurements taken (time, normal force, frictional force) allowed the graph I posted to be devised. Then, I was calculating the ratio between the two forces to get the frictional coefficient. I was expecting a peak in frictional force at 2, corresponding the static friction where i could measure the ratio. Then, I was going to measure the ratio in region 3 to determine the kinetic coefficient. But i dont have a peak for static, which makes evaluation of static friction impossible(?) $\endgroup$ Commented Apr 27, 2016 at 14:38
  • $\begingroup$ How are you measuring friction? Static friction may occur over such small time period that you might not see it. $\endgroup$ Commented Apr 27, 2016 at 14:38
  • $\begingroup$ I am measuring friction using a force sensing rig. The specimen is lowered onto a sample which is stuck to a force plate (region 1). then, the specimen is moved laterally, which generates a frictional force in response. I'm measuring at a sample rate of 1 kHz, so I was expecting to see static frictional regiion somewhere. It seems illogical that static friction peak lasts less than 1/1000 of a second. $\endgroup$ Commented Apr 27, 2016 at 14:40

1 Answer 1

1
$\begingroup$

In your graph you have only plotted kinetic friction as a function of time and by the formula

$$F_k=\mu_kN$$

it remains constant because it is independent on the force(horizontal) you apply, surface area, time etc. however if you also include static friction in your graph it would have looked more like this:

enter image description here

Source: http://deutsch.physics.ucsc.edu/6A/book/forces/node21.html

From graph we can see:

Kinetic friction - remains constant

Static friction - increases and is equal to the force applied to remain in equilibrium until applied force is smaller than: $$F_s=\mu_sN$$

based on experimental observation it almost always turns out that static coefficient of friction is greater than kinetic coefficient of friction

$$\mu_s>\mu_k$$

Therefore the maximum force that we can apply on an object so that it can remain in equilibrium is greater than the force of kinetic friction which is constant, because of this we can observe that force of friction is decreasing when the object starts moving which is seen in the graph above colored in green.

$\endgroup$

Your Answer

By clicking “Post Your Answer”, you agree to our terms of service and acknowledge you have read our privacy policy.

Not the answer you're looking for? Browse other questions tagged or ask your own question.