I have a real world question but I think it'll be clearer if I phrase it like a "homework" question so here goes*:
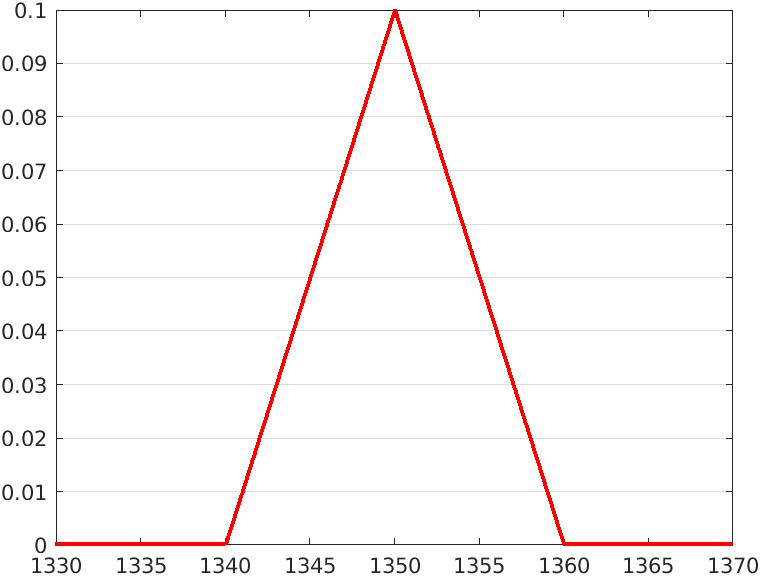
A physicist is trying to use a laser measuring device to determine the length of a piece of string with high accuracy. Their device has a nominal resolution of $\pm 10 \mu m$, which the user manual goes on to explain refers to the edges of a triangular probability distribution of where the true value the device reads might lie. That is the readings it outputs are in 10 micron increments and a value of $1,350 \mu m$ actually represents a triangular probability density function centred around $1,350$ with width $\pm 10$ (see diagram below)

The physicist also notices though that the device is inconsistent; when they try to calibrate it by measuring a known length of string, there is some seemingly random noise in the readings. They decide that by taking a few samples of known lengths and seeing how far off the device is, they can find a probability distribution for the typical error in the device and subtract this from the readings to calibrate it.
The experimental setup is simple. For a known length calibration piece of $1000\mu m$, several measurements are taken. These might be as below:
| Measurement No | Value ($\mu m$) |
|---|---|
| 1 | 1050 |
| 2 | 1010 |
| 3 | 980 |
| 4 | 990 |
| 5 | 1010 |
| 6 | 1000 |
| 7 | 1040 |
| 8 | 980 |
... so clearly there is some rounding owing to the instrument resolution, and some uncertainty from other factors. Using this information, the physicist would like to model the error as a Normal distribution $Err\sim\cal N\left( {\mu,\sigma^2} \right)$ and calculate the most likely values for those parameters...
* The caveat for asking this in homework style is I may have missed out some important details required to give an answer, so if you need clarification or more details please ask
My approach
Ok so I have 2 approaches:
- At first I thought of fitting a normal distribution to the data. This is done by first plotting each measurement and its triangular resolution pdf. I then find $\mu$ (which is just $\bar{x}$, easy to calculate since the resolution error is symmetric). Finally I find the value of $\sigma$ which maximises the overlap between the measurements and the resultant distribution with integration - i.e. maximises the likelihood of observing those measurements weighted by their resolution distributions.
- However I remembered that samples from a normal population are t-distributed - appearing closer to the centre than expected and having a smaller standard deviation than the population would (making the first approach inaccurate). To solve this, I could try and fit a Student t-distribution to my samples, however I wasn't sure how many degrees of freedom to use since my measurements are pdfs, not individual values.
So I'm a bit stumped on how to fit to a t-distribution or what adjustments I need (given the small sample count and large relative resolution error, $\sigma$ I expect will be larger than just the sample standard deviation of the data itself).
