10
$\begingroup$

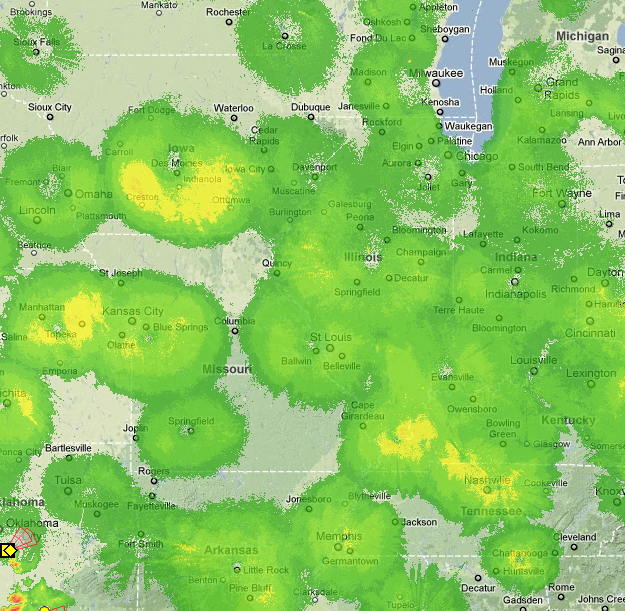
The radar image of the midwest provided by Weatherunderground at 10:30 PM Central time, May 8 2011 has odd patterns.

Are these patterns real? Perhaps caused by large scale convection over cities? Or are they artifacts of radar placement?

Here is the image that I am referring to, where green indicates light and yellow moderate rain: enter image description here

$\endgroup$
4
  • $\begingroup$ Interesting. I think it is "well known" that cities get more rain. It would need a number of such photos to prove statistically that rain is circular around population centers. Is there no archive? $\endgroup$
    – anna v
    Commented May 9, 2011 at 4:55
  • $\begingroup$ Its really an interesting question. But @anna is right, one will need a lot more data to do some real analysis - everything else is just speculation. There must also be some related work done already. $\endgroup$ Commented May 9, 2011 at 7:35
  • $\begingroup$ @anna @Robert I can see where more data would be helpful, but not required, for statistical inference. There are plenty of replicate cities in the image. However, I think that it is more important to consider if the scale and shape of these phenomena is consistent with what would be expected to occur from urban convection, which I suspect it is not. $\endgroup$ Commented May 9, 2011 at 13:54
  • 2
    $\begingroup$ I've seen this occurring usually at night: the display shows "rain" for a certain radius around the radar tower, even when I can look outside and see that it's not actually raining in that area. So I'm fairly sure it's an artifact. Remember that the radar doesn't directly detect rain (or snow), it looks for reflection patterns that are characteristic of certain kinds of precipitation, so it's not that hard to fool - the question is just what exactly is the cause of the effect. $\endgroup$
    – David Z
    Commented May 9, 2011 at 19:58

2 Answers 2

4
$\begingroup$

I have a master's degree in meteorology so I think I can clear this up for you!

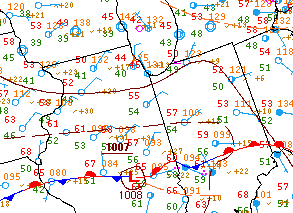
This is simply ground clutter. You will see this sort of thing happening on evenings where the relative humidity is very high, more so when the mixing ratio is high also. The radar beam can actually start to interact with water droplets in the air when your humidity values are very high. You are more likely to max out your humidity values during the night as the air temperature falls and approaches the dewpoint. Indeed, if you look at the image I posted below you will see that in the area your radar image depicts, the relative humidities are near 100% in most of these areas. You can see that in many areas the temperature/dewpoint ratio is near 100%. For example, there are values on the map such 44/40, 55/54, 57/54, 50/49...very humid.
enter image description here

(Surface Analysis on May 8, 2011 0300Z(10PM CDT). Image is taken from http://www.hpc.ncep.noaa.gov/html/sfc_archive.shtml where you can then retrieve the surface analysis for any day you wish through March 30, 2006.
$\endgroup$
2
  • $\begingroup$ thanks for your answer, but could you explain which values on the map are humidity, and which are dewpoint? $\endgroup$ Commented Aug 20, 2012 at 16:32
  • $\begingroup$ Ah, yes I forgot to mention that. On these types of surface analysis maps, humidity is not explicitly labeled. If you look at the station located directly in the center of the map, you will see two numbers: 55 and 54. 55 is the air temperature in Fahrenheit and 54 is the dewpoint in Fahrenheit. Since I'm not sure if you want the physical equations, just look at it this way: the closer the temperature is to the dewpoint, the more humid it is. For example, the station we are talking about probably has a relative humidity of somewhere between 95-99%. If you want the math let me know. $\endgroup$ Commented Aug 20, 2012 at 16:56
3
$\begingroup$

No proposed urban rainfall effect is dominant enough to cause that picture. But limited radar range, with radars being located in larger cities would easily explain it. The urban rainfall enhancement effect would have to be pretty extreme for it to be otherwise.

$\endgroup$
1
  • $\begingroup$ Are the cities those having some Broadcast station? Such a station might operate or pay for a rain radar. $\endgroup$
    – Georg
    Commented May 9, 2011 at 19:58

Your Answer

By clicking “Post Your Answer”, you agree to our terms of service and acknowledge you have read our privacy policy.

Not the answer you're looking for? Browse other questions tagged or ask your own question.