6
$\begingroup$

Below is experimental data for the ratio $$R=\frac{\sigma(e^+e^-\rightarrow hadrons)}{\sigma(e^+e^-\rightarrow\mu^+\mu^-)}$$ as a function of the centre of mass energy $\sqrt s$.enter image description here
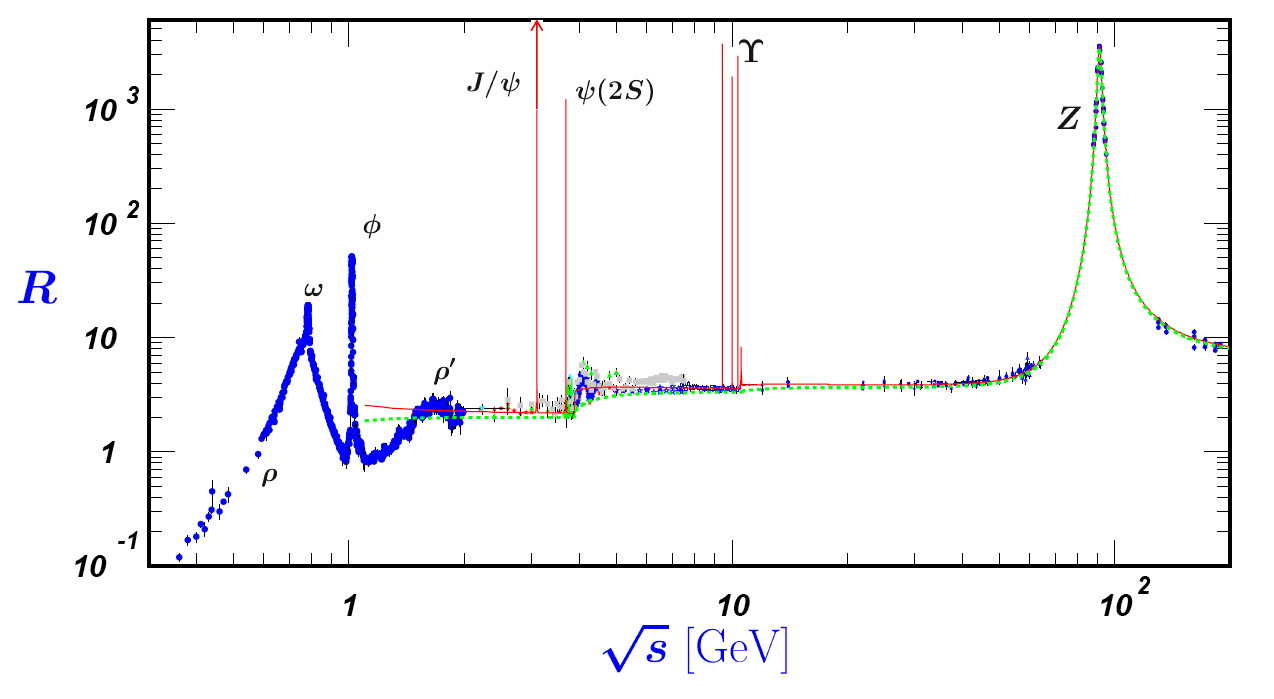
I am interested in the peak at around $100GeV$ which corresponds to the resonance of the $Z^0$ boson. There are two ways of looking at this that I have in mind:

  1. We can effectively ignore the electromagnetic process around this energy, and so each process should have it's own Breit-Wigner peak centred on the mass energy of the $Z^0$. The ratio of these is just a constant.
  2. Thinking in terms of Feynman rules and again ignoring the electromagnetic process around this region, each process has the same propagator and vertex factors (roughly - ignore quark mixing) and there are some extra factors due to different quarks being possible and colour degeneracy, but still the ratio should be a constant (one possible issue here is interference between Feynman diagrams which I have neglected?).

So my question is why does the peak exist in the data?

$\endgroup$

1 Answer 1

6
$\begingroup$

[The figure shown in the OP question above ...] is experimental data for the ratio $R = $ [...] as a function of the centre of mass energy $\sqrt{s}$

The so called cross section ratio $$R[~\sqrt{s}~] = \frac{\sigma^{(0)}[~e^+~e^- \rightarrow \text{hadrons}, \sqrt{s}~]}{\sigma^{(0)}[~e^+~e^- \rightarrow \mu^+~\mu^-, \sqrt{s}~]}$$ ??

Actually, surprisingly, No!;
that's not (quite) what's shown there; and therein lies the answer to your question.

Rather, as the caption of PDG Figure 44.6 explains (and surely the PDG is the authoritative source) the figure shows instead the ratio of the experimentally determined hadronic cross section (incl. suitable corrections), $$\sigma^{(0)}[~e^+~e^- \rightarrow \text{hadrons},\sqrt{s}~]$$ and a "normalization denominator" $$ \frac{4}{3}~\pi~\alpha^2[~s~] ~/~ s,$$ where apparently $\alpha[~s~]$ expresses electromagnetic coupling only, i.e. without accounting for weak coupling which is experimentally dominant at center-of-mass energy near the nominal mass of the $Z^0$ boson.

Consequently, while the arguments laid out in the OP seem quite compelling to me, they don't address what's actually presented in the figure, including the obvious "$Z^0$ peak". (I consider the OP question quite astute nevertheless, +1; and I even hope that it might lead the PDG to reconsider the labelling of its Figure 44.6.)

$\endgroup$

Your Answer

By clicking “Post Your Answer”, you agree to our terms of service and acknowledge you have read our privacy policy.

Not the answer you're looking for? Browse other questions tagged or ask your own question.