How can we plot the energy density $\rho$ as a function of the age $t$ of the universe (or temperature $T$) from the time of radiation domination to the time of cosmological constant domination with intermediate matter domination phase? I know that $$a\propto t^{1/2}, t^{2/3}, e^{\Lambda t}$$ in the radiation, matter, and CC dominated phases respectively. Therefore, $$\rho\propto t^{-2}, {\rm constant}$$ for radiation/matter domination and CC domination respectively. In short, I am looking for a continuous curve $\rho(t)$ vs $t$. Can we identify the crossover from radiation to matter domination in this curve?
-
$\begingroup$ A complete history means that there are eras when the universe is not dominated by one of these, and the scale factor therefore does not evolve as you say. You can integrate the Friedmann equations taking into account all three contributions to get the curve you want, and the curve of each contribution, including their crossover points. I didn’t manage to find a graph of the total on the internet. I found two graphs of the three separate contributions but they were inconsistent with each other. $\endgroup$– G. SmithCommented Dec 13, 2020 at 21:54
-
$\begingroup$ pages.uoregon.edu/jimbrau/BrauImNew/Chap27/7th/… $\endgroup$– G. SmithCommented Dec 13, 2020 at 22:13
-
$\begingroup$ sites.ualberta.ca/~pogosyan/teaching/ASTRO_122/lect30a/… $\endgroup$– G. SmithCommented Dec 13, 2020 at 22:14
-
$\begingroup$ Note that both are log-log plots but in one the radiation and matter curves bend up and in the other they bend down. I haven’t tried the integration myself so I don’t know which is correct. Note that if the time dependence were $t^{-2}$ the two curves would be straight lines. $\endgroup$– G. SmithCommented Dec 13, 2020 at 22:16
-
$\begingroup$ It’s possible that they disagree because one of them takes into account how the radiation interacts with the matter, rather than considering a simple noninteracting mixture. I don’t understand how this interaction is usually modeled in cosmological computations. $\endgroup$– G. SmithCommented Dec 13, 2020 at 22:23
1 Answer
Solidification asked: "How can we plot the energy density ρ as a function of the age t of the universe (or temperature T) from the time of radiation domination to the time of cosmological constant domination with intermediate matter domination phase?"
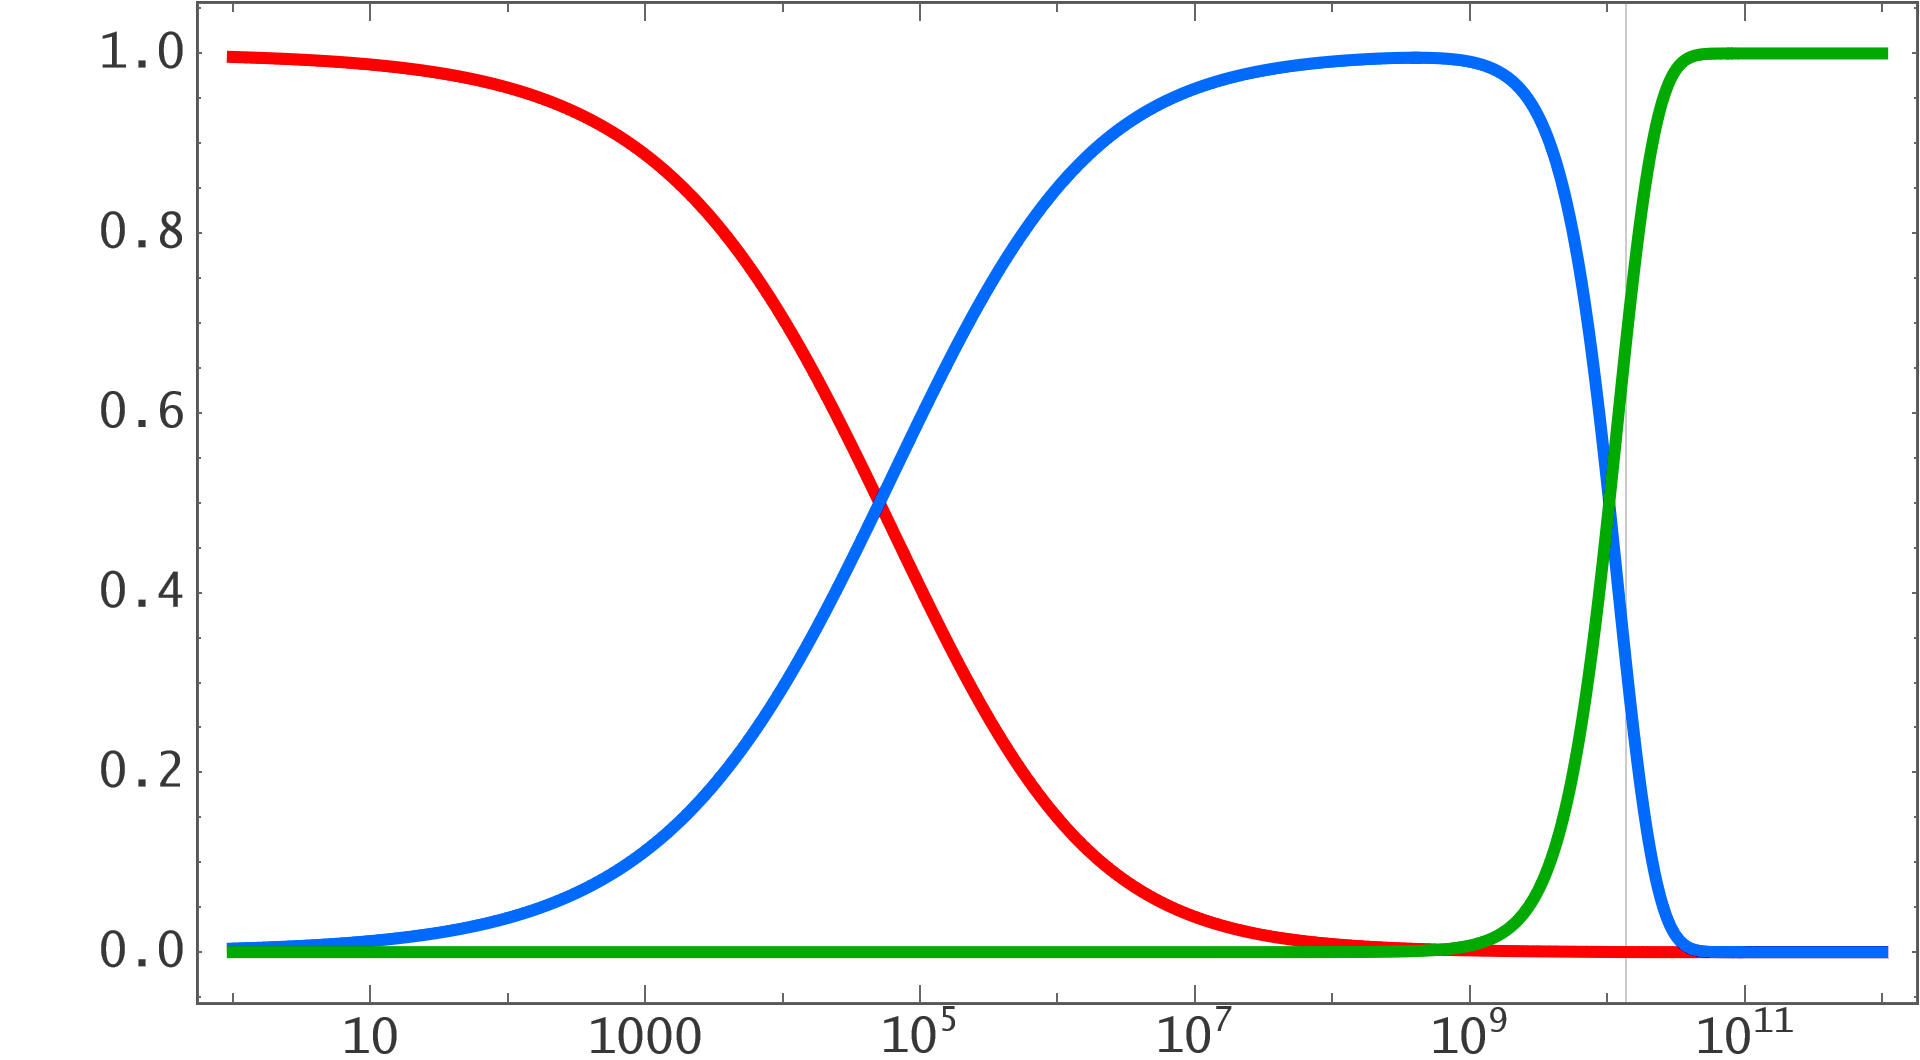
For the Ω I recommend a log/linear plot where the time (on the x-axis) is logartihmic and the Ω (on the y-axis) are linear. Red is for radiation, blue for matter and green for dark energy:
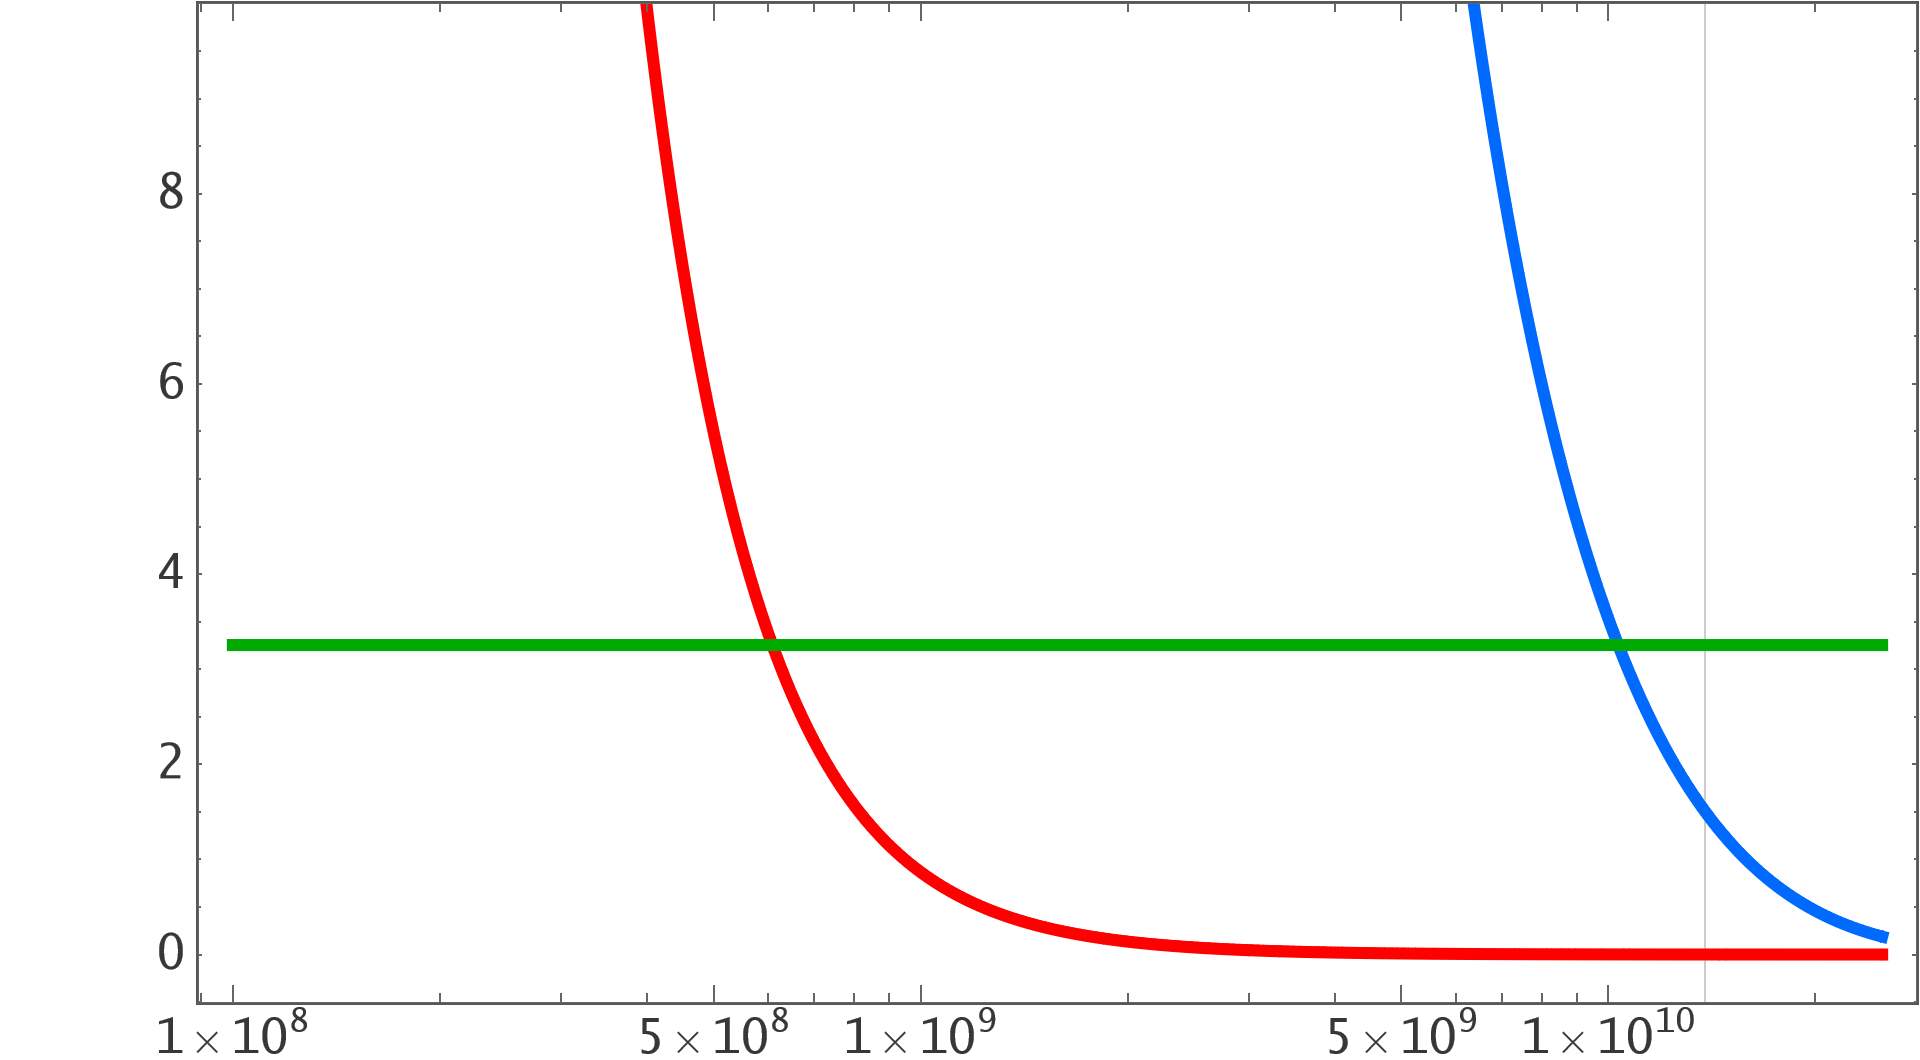
We have radiation to matter parity at 50000 years after the big bang, radiation to dark energy parity at 600 million years, and matter to dark energy parity at 10¹⁰ years. ρ (in GeV/c²/m³):
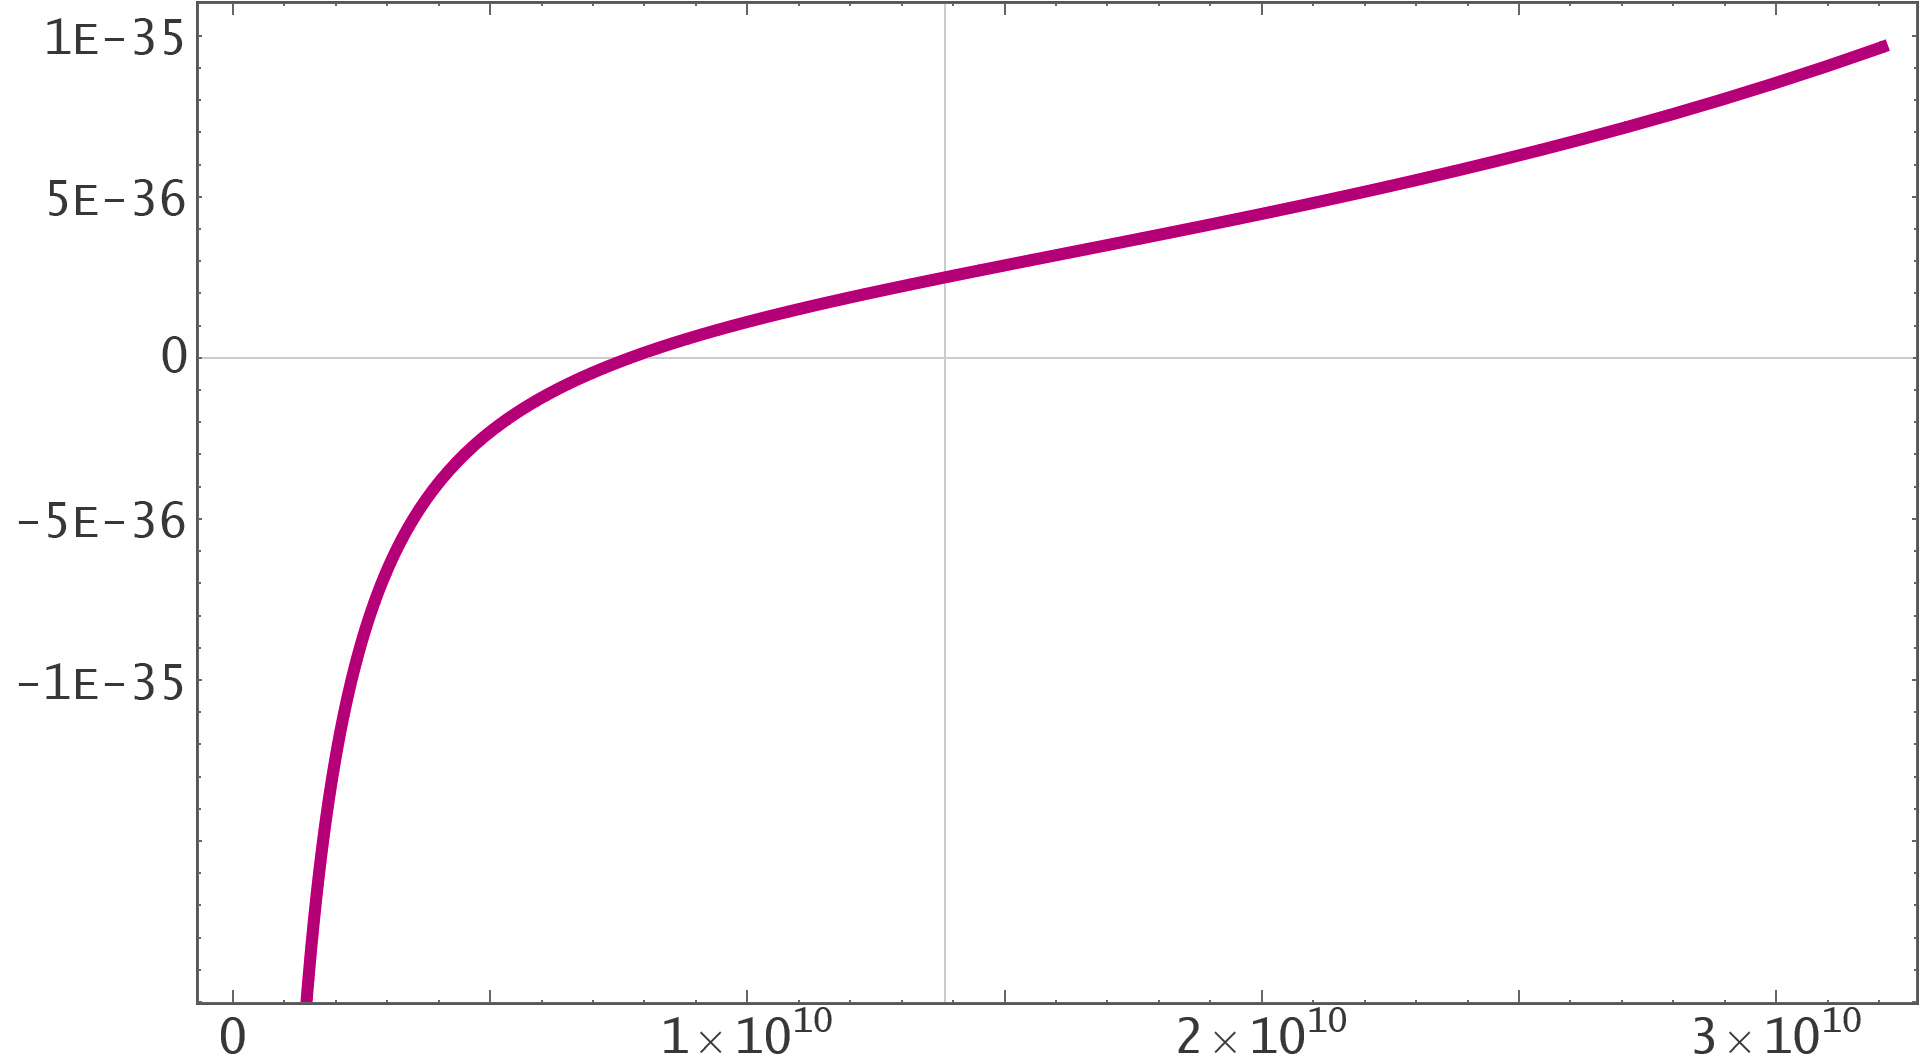
The accelerated expansion however does not start when Ω or ρ for dark energy becomes the largest, but when ä=0, which is at around 7.7 billion years (this plot is linear on both axes):
If you click on the images you get different combinations of logarithmic and linear axes and plot ranges, where different features are highlighted. The equations are also linked in the description on the bottom of the first two links, where you can also find the initial values for the cosmological parameters.


