1
$\begingroup$

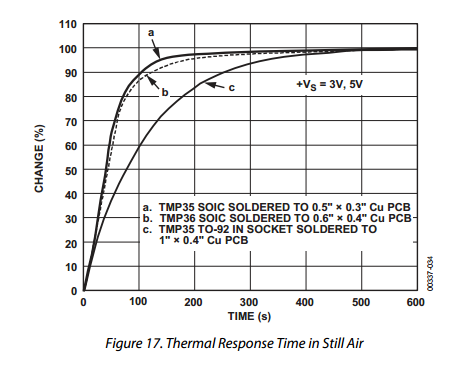
The following is LM35 Thermal response time in air

enter image description here

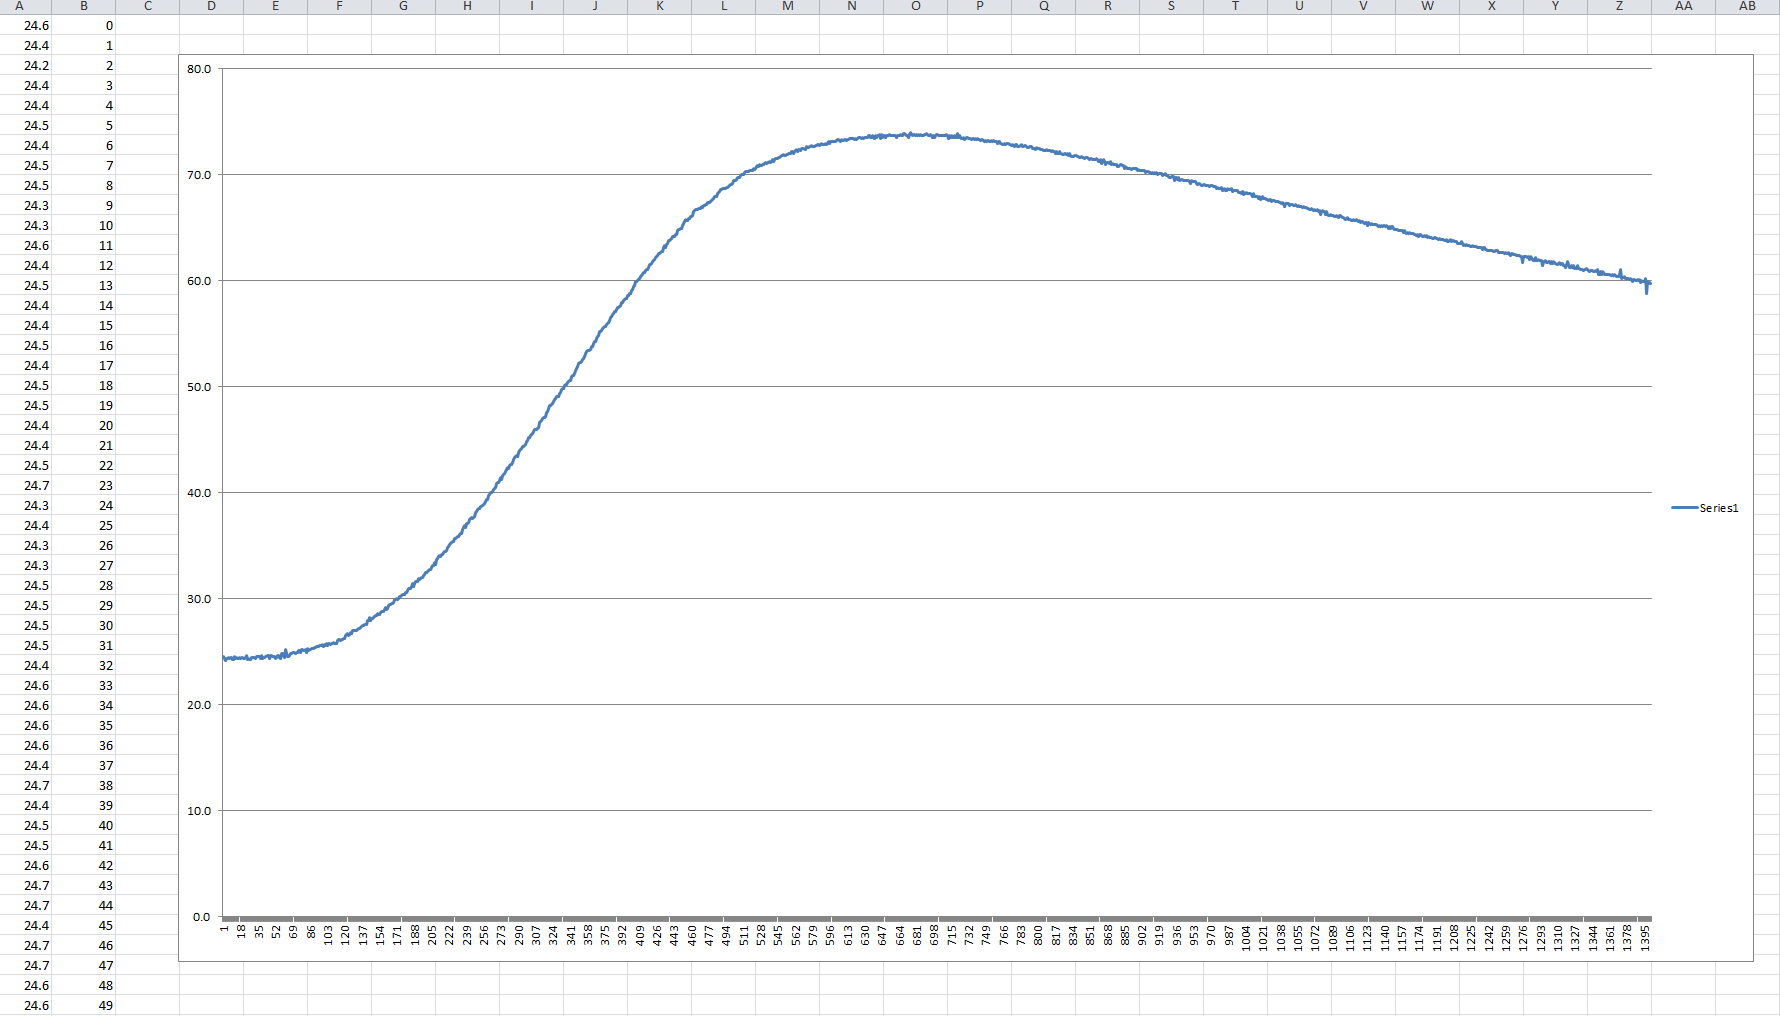
The following is temperature reading from LM35 sensor. Horizontal axis is time in sec.

enter image description here

So this is not "real-time" temperature graph. The question is having thermal response graph, how to best adjust real readings from sensor to get "real-time" values?

$\endgroup$

2 Answers 2

3
$\begingroup$

What you probably want to do is deconvolution. For that you need the impulse response function. What you have is the response to a step function. You need to deconvolve the respnse function you have with a step function to get the impulse response function of your instrument and then deconvolve your data with that.

One problem with deconvolution is that it can amplify noise, but I don't know if that will be a problem in your case.

Edit: Details on request.

Let $T(t)$ be the true temperature and $M(t)$ your measured temperature. They are related like this:

$$ M(t)=\int T(\tau)f(t-\tau)d\tau $$

where $f(t)$ is the impulse response function. What you have is $F(t)$ given by:

$$ F(t)=\int H(\tau)f(t-\tau)d\tau $$

where $H(t)$ is a Heaviside step function. Fortunately you don't need to deconvolute $F(t)$ as I said above. Simply differentiating $F(t)$ should do:

$$ f(t)=F'(t) $$

Now, you have $M(t)$ sampled in a number of points $t_i$, let's call the the samples $M_i=M(t_i)$. Similarly, the true values at another set of time points $\tau_j$ can be called $T_j=T(\tau_j)$. The integral can now be approximated with a sum:

$$ M_i=\sum_j T_jf(t_i-\tau_j)\Delta\tau_j $$

where $\Delta\tau_j$ is the distances between the $\tau_j$:s. This is now a linear equation system:

$$ M_i=\sum_j T_jA_{ij} $$

with the coefficients given by:

$$ A_{ij}=f(t_i-\tau_j)\Delta\tau_j $$

Solve it to for $T_j$ to get the true temperatures. The trickier parts might be to make sure $f(t)$ is correctly normalized and choosing your set of $\tau_j$. It should probably be similar to the set of $t_i$, but maybe they should be a bit sparser to make it more robust.

This is the basics. You might have do some tinkering. Also, there are probably more advanced algorithms for deconvolution that are less noise sensitive.
$\endgroup$
6
  • $\begingroup$ This is the datasheet for the sensor. Is there any chance you can give some example on how to do that? Reading those wiki articles doesn't give me much idea how to extract data from datasheet and how to convert it to function. $\endgroup$
    – Pablo
    Commented Jan 12, 2013 at 17:36
  • $\begingroup$ Yes, getting numerical values from the graph you have might be the trickiest part. Either you sample the function in the graph manually (i.e. you read out its values in maybe 10-20 points), or you approximate it with a suitable analytical function, or you try to recreate the function by doing your own measurements if you have access to the instrument. $\endgroup$
    – jkej
    Commented Jan 12, 2013 at 17:45
  • $\begingroup$ ok, say I will create a function F(time), which will give me the temperature value corresponding to manufacturer graph. What is next? $\endgroup$
    – Pablo
    Commented Jan 12, 2013 at 17:47
  • $\begingroup$ Before I go into detail, do you think that you will do this manually (i.e. do the all the numerics yourself) or will you try to use pre-written code in some type of numerical software (Matlab, Python, Mathematica)? $\endgroup$
    – jkej
    Commented Jan 12, 2013 at 18:06
  • $\begingroup$ I will do it manually - take 5-6 points from the manufacturer graph and interpolate in the code for the given t. $\endgroup$
    – Pablo
    Commented Jan 12, 2013 at 18:08
1
$\begingroup$

You would need to know the transfer function of your sensor, but as a first approximation the graph you have from the manufacturer seems compatible with something like:

$$\frac{dT_s}{dt}=k(T-T_s)$$

where $T$ is the outside temperature and $T_s$ the sensor reading. You could then estimate $T$ as

$$T=T_s+\frac{1}{k}\frac{dT_s}{dt}$$

To figure out $k$, notice that under a stationary $T$, i.e. what the manufacturer graph is showing, the response curve of $T_s$ would be

$$T_s-T_{s0} = T(1-e^{-kt})$$.

$\endgroup$
2
  • $\begingroup$ dTs is temperature and dt is time from graph? What is Ts0? $\endgroup$
    – Pablo
    Commented Jan 12, 2013 at 17:39
  • $\begingroup$ @Pablo The reported temperaure at the beginning of data collection. That is $T_s(t = 0)$. $\endgroup$ Commented Jan 12, 2013 at 18:01

Your Answer

By clicking “Post Your Answer”, you agree to our terms of service and acknowledge you have read our privacy policy.

Not the answer you're looking for? Browse other questions tagged or ask your own question.