2
$\begingroup$

I've seen many times people estimating the energy just by looking at the temperature curve, but for me, it's a bit hard to understand how can they do it so fast and efficient. Therefore I would like to ask if anyone can help me to figure out how to get the total energy from a Temperature - Time plot. For this, I have formulated a simple example where 1 kg of water is heated with 50 [kW].

Parameters:
m = 1 kg
P = 50 kW
Cp = 4.186 kJ/(kg.K)
Tinit = 20 C

So by using:

$$m C_p \dfrac{dT}{dt}=P \tag{1}$$

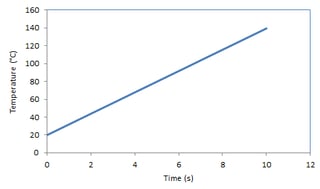
One ends up with a graph like this:

enter image description here

And the values can be put in table:

t   T
----------
0   20.00
1   31.94
2   43.89
3   55.83
4   67.78
5   79.72
6   91.67
7   103.61
8   115.56
9   127.50
10  139.45

Now the question. Is there any way to look at this plot and tell/calculate the total amount of energy put in for the entire time interval? What would be the methods for that?

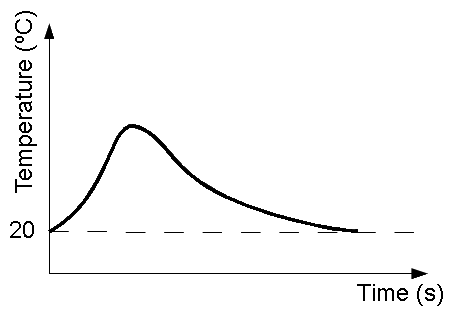
EDIT: Can the same method be used to find the net energy ($E_{in} - E_{out}$) for a curve that has a more complicated profile, such as this one:

enter image description here

$\endgroup$
0

1 Answer 1

2
$\begingroup$

It would just be $mC_p(T_{final}-T_{initial})$, assuming that the heat capacity doesn't vary much with temperature over the temperature range of interest.

$\endgroup$
11
  • $\begingroup$ Thank you, but this formula would not work for a more complicated profile. I have edited the question to make it more clear. Now the T_final - T_initial = 0, which gives E = 0 kJ. It is 0 kJ for that time instance, but not accumulated. $\endgroup$
    – Physther
    Commented Feb 3, 2017 at 13:20
  • $\begingroup$ To get the temperature variation you get in your second figure, you must be removing heat from the material as well as adding heat. In the final state, the amount of heat you have removed just matches the amount of heat you have added, so here again, the net energy change is zero $\Delta E =0$. The only way you can determine the specific amount of heat added for a curve like this is to know the amount of heat that was removed. This requires a heat transfer calculation involving heat conduction to the cold reservoir. $\endgroup$ Commented Feb 3, 2017 at 15:16
  • $\begingroup$ I hear you, and I totally agree, but believe me, I saw colleagues that can estimate the amount of energy just by looking at such a curve and making approximations. They are always right. I can guess that they are approximating such a curve with geometries and get the area from under the curve, but how would that work? Would it? Are they geniuses or what? $\endgroup$
    – Physther
    Commented Feb 3, 2017 at 15:22
  • $\begingroup$ They are correct if we are talking about the net amount of heat added (i.e., the cumulative amount added minus the cumulative amount removed up to any point along the path). If we are only talking about the amount of heat added from the power source, then that is just equal to the power times the time. $\endgroup$ Commented Feb 3, 2017 at 15:30
  • 1
    $\begingroup$ @Physther. You don't have to doubt the equation Chester Miller has given here. Note that it doesn't involve time. The equation simple tells how much energy it takes to reach a new temperature - regardless of how you added the energy (regardless of how fast you heated it up, how much this heat fluctuated etc). There is no reason it should change because a temperature-time graph fluctuates; time is not involved at all. If you just pick a point on the curve (pick a temperature), that equation tells how much energy is absorbed at that moment in order for the object to have that temperature. $\endgroup$
    – Steeven
    Commented Feb 4, 2017 at 0:30

Your Answer

By clicking “Post Your Answer”, you agree to our terms of service and acknowledge you have read our privacy policy.

Not the answer you're looking for? Browse other questions tagged or ask your own question.