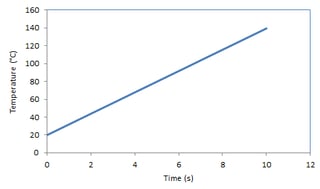
I've seen many times people estimating the energy just by looking at the temperature curve, but for me, it's a bit hard to understand how can they do it so fast and efficient. Therefore I would like to ask if anyone can help me to figure out how to get the total energy from a Temperature - Time plot. For this, I have formulated a simple example where 1 kg of water is heated with 50 [kW].
Parameters:
m = 1 kg
P = 50 kW
Cp = 4.186 kJ/(kg.K)
Tinit = 20 C
So by using:
$$m C_p \dfrac{dT}{dt}=P \tag{1}$$
One ends up with a graph like this:
And the values can be put in table:
t   T
----------
0   20.00
1   31.94
2   43.89
3   55.83
4   67.78
5   79.72
6   91.67
7   103.61
8   115.56
9   127.50
10  139.45
Now the question. Is there any way to look at this plot and tell/calculate the total amount of energy put in for the entire time interval? What would be the methods for that?
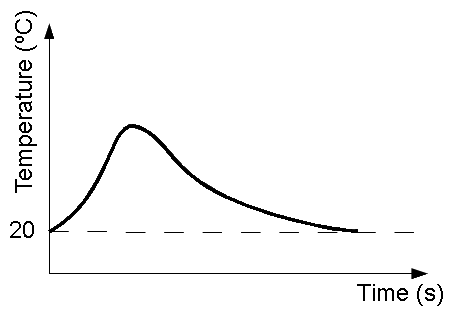
EDIT: Can the same method be used to find the net energy ($E_{in} - E_{out}$) for a curve that has a more complicated profile, such as this one:


