2
$\begingroup$

I have taken IV measurements for several LEDs and now need to calculate their injection efficiencies.

I understand that the injection efficiency:

$\eta_{pn} = I_{D}/I$

Where $I$ is the total current flowing (operational current?):

$ I = I_{D0}e^{q(V-IR_{S})/m_{D}k_{B}T} + I_{R0}e^{q(V-IR_{S})/m_{R}k_{B}T}$

Where $I_{D}$ is the diffusion/radiative recombination current, and $I_{R}$ the non-radiative recombination current with the zero subscript denoting saturation values, $R_{S}$ being the series resistance of the device and $m_{D}$, $m_{R}$ being the ideality constants of the device.

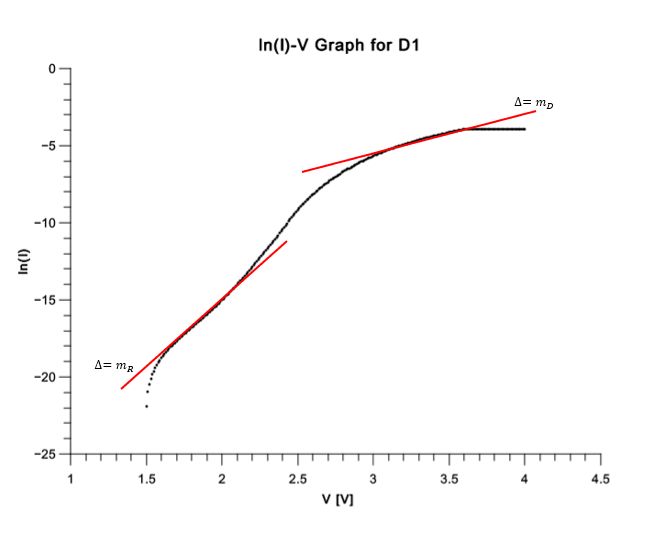
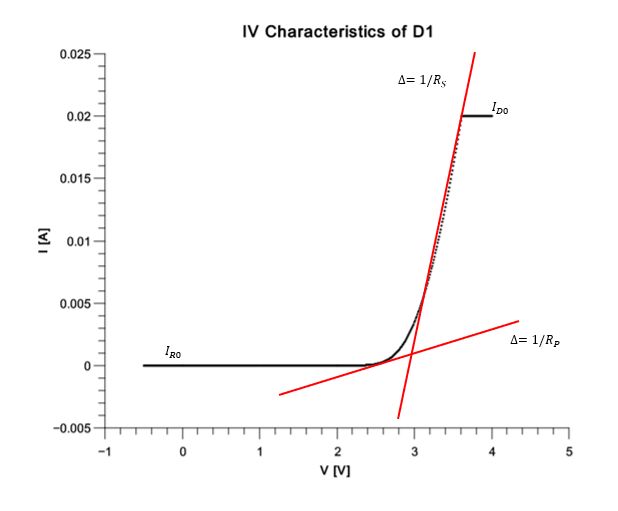
I think that the above values can be gained by analysis of the I-V and ln(I)-V graphs, however am struggling to reproduce the measured IV characteristic curve by plugging in the numbers I determined into the above equation.

IVGraph

ln(I)VGraph

From the above, I found $R_{S} \approx 28.34 \Omega$ and $R_{P} \approx 376 \Omega$, $m_{D} \approx 3.95$ and $m_{R} \approx 8.70$; the idealities seem very high, compared to the ideal values of 1 and 2, respectively. Furthermore, the values of $I$, $I_{D}$ and $\eta_{pn}$ calculated gave ridiculously high values.

My questions are whether my method here is correct; what values are realistic for the ideality factors and also what value one should expect to end up with for injection efficiency?

$\endgroup$

1 Answer 1

2
$\begingroup$

Your formulas for calculating injection efficiency and the diode model are basically correct and the extraction of the series resistance is also correct but your analysis of the ideality factors is not quite right.

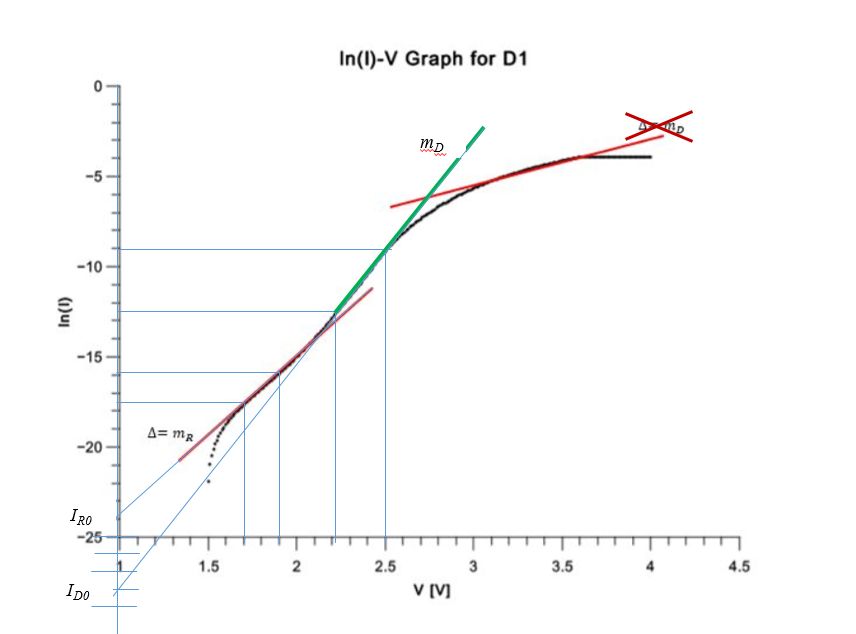
The radiative recombination slope is that small section right after the first slope that you highlighted in red (I highlighted it in green below). The second slope you drew at the top right is not correct… that’s well into the series resistance limited part of the diode behavior.

The curve shows that non-radiative recombination dominates in the region with the red slope and radiative recombination dominates on the green slope and in the series resistance limited portion. The injection efficiency should climb very quickly with voltage from the point where the two slopes start to diverge (about 2.3V).

The ideality factors are crazy high so there is something not quite right here. Your voltage scale seems to have some sort of offset of a realistic voltage. The clue is where the current is dropping to zero. It looks as though the zero of your voltage scale is at 1.5V but it's not an offset because that won't fix the ideality factors... it's both an offset and a scale factor.

Taking it at face value and using the notation in your link the two ideality factors are

$m_D = 3.08$ and $m_R = 4.81$

I erased earlier values of the reverse saturation currents because there is something not quite right about the measured data. The zero of voltage across the LED should be where the measured data turns down vertically, at about 1.5V. This indicates a 1.5V offset to the voltage scale.

The idealities aren’t very sensible! Sensible ideality factors are in the range of 1 to 2. That translates to 2.3 units on your log scale current for every 60 mV (60 mV/decade) to 120 mV. You can ignore the IRs term in the model until the curve starts to bend away from the green slope (at about 2.6V) otherwise the solution is by iteration. There is essentially no voltage drop across the series resistance below this voltage.

Diode IV curve showing the slope in the radiative recombination region

$\endgroup$

Your Answer

By clicking “Post Your Answer”, you agree to our terms of service and acknowledge you have read our privacy policy.

Not the answer you're looking for? Browse other questions tagged or ask your own question.