0
$\begingroup$

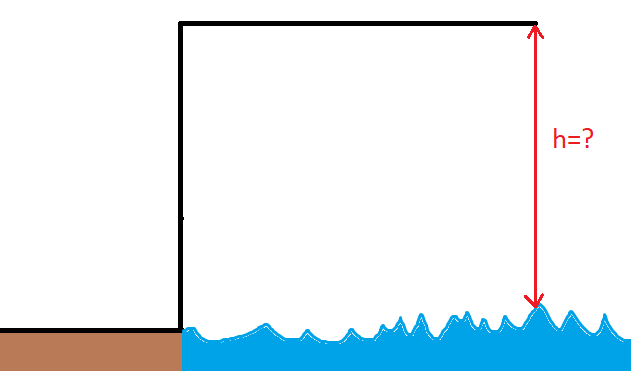
I want to measure average distance between fixed metal construction and water, as shown in the picture below to predict water flood. Let's call this distance water level h. If the water level starts rising, then I need to inform the local people that the flood is coming and they have to do something, etc.

enter image description here

By black color, I show fixed metal construction, which is not moving. The blue color is water under this metal construction. Let say water is a lake which always has some waves and never stays calm. and waves are not right Sin shape, but random.

I have an ultrasound/laser or any other measurement device which can measure the distance between the device and the water with 0.1cm error very fast (much faster than water waves changes, for example in 1ms). I do many measurements (100-200 times), and I calculate an average water level in relation to my metal construction.

For example, I got average h=123.2 cm after 100 measurements, but because water is always moving the standard deviation is high, like 20 cm.

In this example, can I tell that the water level h=123.2±0.1 cm or I can tell only h=120±20cm because the standard deviation is 20cm?

In other words, if today I get average h=123.2cm, tomorrow I will get h=130.5cm and the standard deviation is the same 20cm, then should I inform people that flood is coming or I cannot because water level difference is less than the standard deviation, that means it is below my error and I cannot really tell if water level is going up or down.

This is just an example to demonstrate the question. There is no real task like this. It can be replaced by another example (measuring cylinder diameter when it is not ideal cylinder) or something else where the error of the device is much less than the standard deviation.

$\endgroup$
3
  • $\begingroup$ A point to remember is that it is not the average which is going to start the flooding it is the values above the average and you should start worrying when the mean plus two or three standard deviations is above your threshold height. Better safe than sorry. $\endgroup$
    – Farcher
    Commented Sep 21, 2018 at 6:56
  • $\begingroup$ @Farcher then in my example if average was 123.2 with standard deviation 20cm and after sometime average increased by 7 cm to 130 cm (which is less then standard deviation 3 times) I should not be worried at all. But if average will be 160 cm or more, then I should be worried? Did you mean this? $\endgroup$
    – Zlelik
    Commented Sep 21, 2018 at 7:30
  • $\begingroup$ It is the current average times n standard deviations where n is what you need to decide on. I would worry if a significant number of values is above average plus two standard deviations. $\endgroup$
    – Farcher
    Commented Sep 21, 2018 at 8:07

3 Answers 3

1
$\begingroup$

Generally such problems don't readily work by a simple application of simple statistics. A standard deviation may not be particularly useful as an indicator. For example, during flooding the wave action may be very different to during steadier conditions.

You also need to know the generic nature of the flood process. Inflow into the lake increases the level all over the lake. Wind pushing the water to one side is very different but can still flood a portion of the lake shore. A water skier coming extra close to the dock may send a 1 meter wave across the dock, which probably should not set off your flood warning system.

You need at least a minimal model of total water in the lake as estimated by level measurements. Probably you need several level measurements at different locations. You need to have these over time in order to get the rate of change of water in the lake.

Then you need to figure out some way to deal with noise. Standard deviation may be useful but may not be. There are lots of trend measurements. For example, there are moving averages.

https://en.wikipedia.org/wiki/Moving_average

That page also gives links to a bunch of other possibilities.

Once you have a model of the total water in the lake you need test data to validate it. You would need to get real observations and compare them to when there was flooding. If your model is accurate time for some celebration. If your model is not accurate, back to work.

$\endgroup$
1
  • $\begingroup$ Actually, water flood is just an example. I just want to understand more how to use standard deviation properly for real measurements. But Moving average is a very good article. I did not know about this. Thanks a lot. $\endgroup$
    – Zlelik
    Commented Sep 21, 2018 at 7:26
1
$\begingroup$

Assuming a normal distribution the chance of a new sample s being $n\sigma$ outside the mean $p_{outside}(s)$ is fixed.

You can see how that's used in the table here https://en.wikipedia.org/wiki/68%E2%80%9395%E2%80%9399.7_rule

Consequently, before declaring a flood, select a value of $n$ that gives you sufficient confidence.

A sample with a $1\sigma$ deviation is 32% likely just to be due to a error (a big wave.)

It's popular to work to about

$3\sigma$ (.027% or likely to occur naturally every 370 samples)

but important results are usually confirmed to

$6\sigma$ (.000000002% or likely to occur naturally every 500,000,000 samples).

or higher.

Eliminating measurement errors will help to achieve a narrower distribution, improving confidence.

$\endgroup$
1
$\begingroup$

For example, I got average h=123.2 cm after 100 measurements, but because water is always moving the standard deviation is high, like 20 cm. In this example, can I tell that the water level h=123.2±0.1 cm or I can tell only h=120±20cm because the standard deviation is 20cm?

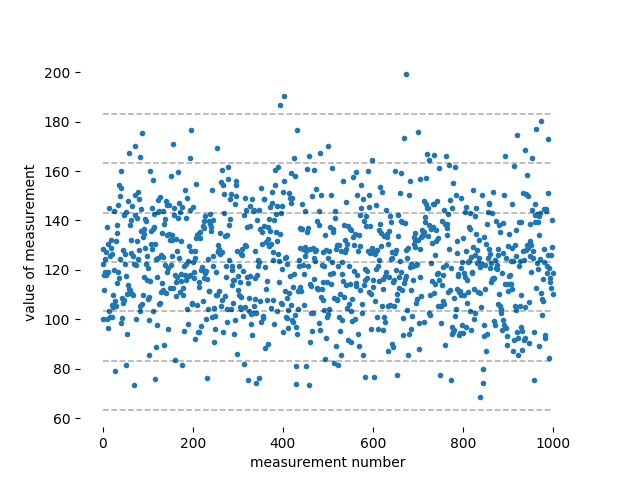
This is a case where actually looking at the data makes it clearer what's happening. Here's some data which has the characteristics you give: a mean of 123.2 cm, and a standard deviation of $\sigma = 20\rm\,cm$. I've assumed a normal distribution, but you can choose a different distribution if you feel like it. These thousand are plotted versus the measurement number:

1k random data points

The dashed lines are at zero, $\pm1\sigma$, $\pm2\sigma$, and $\pm3\sigma$ from the mean. You can see that most of the data lie within the $\pm1\sigma$ band around the mean, and nearly all the data lie within $\pm2\sigma$. Only very rare points lie outside of the $\pm3\sigma$ band. There happen to be exactly three measurements outside of the $\pm3\sigma$ band (near the middle, and all on the side approaching 200 cm), which someone who is new to this business might take as confirmation of the statement in another answer that 99.7% of normally-distributed data points lie within $\pm3\sigma$ of the mean. But the fact that I got exactly three "outliers," and that all of the outliers happen to be on the high side, is a fluke: three three-sigma outliers per thousand points is the average over many thousands of data points, and any particular thousand data points might have a few more or less than three outliers.

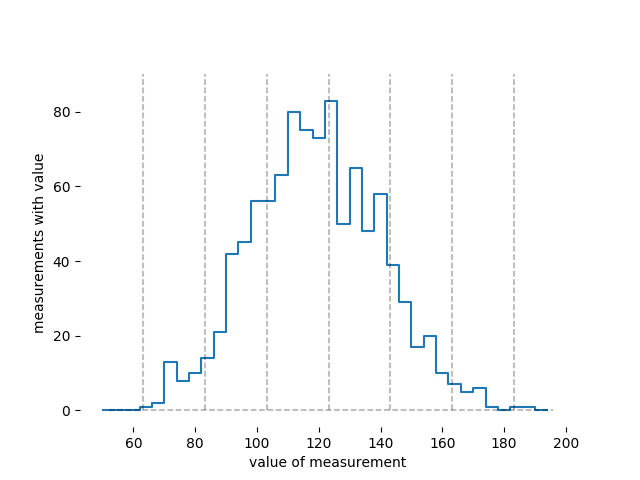
If I collapse these data into a histogram, it looks like this:

histogram of data points

You can see here that a measurement of 130 cm is not uncommon at all; this data set has fifty or sixty measurements in the bin where a measurement of 130 cm would go. When you tell me $(123.2\pm20)\rm\,cm$, I hear "usually between 100 cm and 140 cm."

What's perhaps not intuitive is that you know more about the mean than you do about any particular measurement. The "standard error on the mean" goes like $\sigma/\sqrt N$, where $\sigma$ is the standard deviation of the distribution and $N$ is the number of samples that are included in the computation of the mean. For example, this dataset has $\sigma = 20\rm\,cm$ and $N=1000$, so the uncertainty on the mean is $\sigma/\sqrt N = 0.6\rm\,cm$. The actual mean I compute from these thousand data points is $(123.3 \pm 0.6)\rm\,cm$, which is totally consistent with the mean of 123.2 cm that I put in by hand.

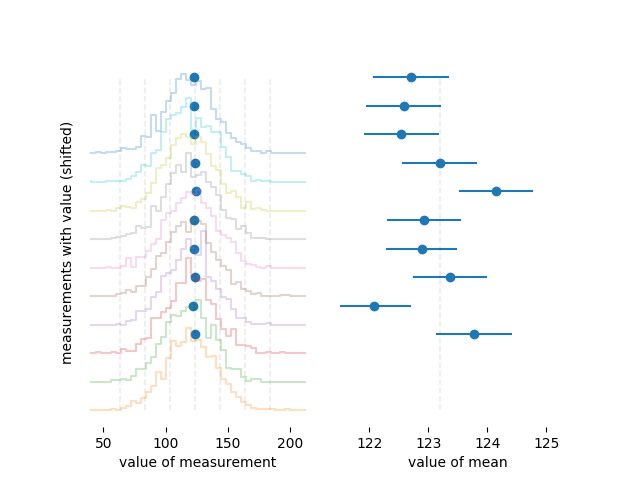
To see a little more clearly the difference between the width of a distribution and the uncertainty on the mean, here are histograms of ten different sets of 1000 measurements each, generated the same way as the one above:

ten histograms

The mean of of each data set is represented with a fat blue dot. On the left, where you can see the entire distribution, you can just barely tell that not all of the means are the same. On the right, where only the means are shown, you can see that the uncertainty estimate $\sigma/\sqrt N = 0.6\rm\,cm$ looks like a good estimator of the uncertainty on the mean, since about two-thirds of the means are within one error bar of the correct value. This is like meta-statistics: doing statistics on the means and standard deviations of several data sets.

This is a general pattern with statistics: it makes more sense if you can actually play with some data where you already know some of the things you're interested in.

$\endgroup$
6
  • $\begingroup$ Thanks for a good answer. I only did not get what means error 0.6cm in your example. If I have a normal distribution σ=20cm, that means with probability 65% value is between 100 and 140 cm. But when I do 1000 measurements and the standard deviation is the same 20cm, what is this 0.6cm? I think it does not matter how many measurements I did, but probability will be the same 65% to find the value between 100 and 140 cm and if I tell 123.3±0.6cm with standard deviation 20cm, then the probability that value is between 122.7 and 123.9 cm is very small, maybe <1%. $\endgroup$
    – Zlelik
    Commented Sep 21, 2018 at 7:22
  • $\begingroup$ I was trying to distinguish between what you can say about any individual measurement and what you can say about an ensemble of measurements. Perhaps the edit will clarify things. $\endgroup$
    – rob
    Commented Sep 21, 2018 at 14:08
  • $\begingroup$ It is a little bit more clear, but still not 100% clear. If we tell that today average water level h=(123.3±0.6)cm in the sense that you explain, then tomorrow it becomes h=(125.3±0.6)cm and in both cases, the standard deviation is 20cm, then should we declare a flood or it is just random deviation and does not mean anything? In other words what 0.6cm means from the physical point of view, not from pure statistics? $\endgroup$
    – Zlelik
    Commented Sep 21, 2018 at 21:58
  • $\begingroup$ When climate folks talk about observing several centimeters of sea-level rise over the past twenty years, they are making exactly the sort of analysis you suggest in your comment. The sea has rapid waves which are much taller than a few centimeters, and tides which are much taller than typical rapid waves, so if you go the beach and take one photograph you will probably observe the water level more than a meter above or below the "mean" level. However, with many observations, it's possible to confirm that the mean sea level is significantly different today than it was in the 1990s. $\endgroup$
    – rob
    Commented Sep 22, 2018 at 2:04
  • $\begingroup$ But still, what this 0.6cm means from physical point of view? standard deviation is clear, when I write 120±20cm (20 cm is standard deviation), that means if I do any measurements, then with 65% probability value will be from 100cm to 140 cm. but what is 0.6cm? Or what would you do in this example: today average water level h=(123.3±0.6)cm in the sense that you explain, then tomorrow it becomes h=(125.3±0.6)cm and in both cases, the standard deviation is 20cm, then would you declare a flood and start evacuating the people or you would do nothing? $\endgroup$
    – Zlelik
    Commented Sep 22, 2018 at 21:36

Your Answer

By clicking “Post Your Answer”, you agree to our terms of service and acknowledge you have read our privacy policy.

Not the answer you're looking for? Browse other questions tagged or ask your own question.