41
$\begingroup$

It always seemed to me that the noise from electric kettles follows a pattern: It starts low, then increases, and decreases again before the water starts to boil.

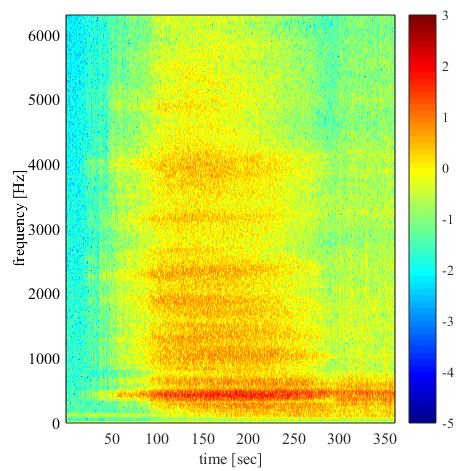
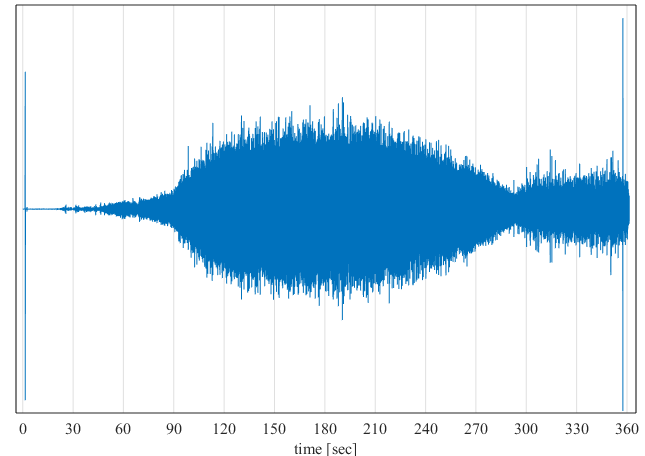
To verify this, I performed a little experiment: I recorded the kettle using my cellphone at sampling frequency $44.1\ \mathrm{kHz}$. I used $1.2$ liters of water at room temperature (well, it's just normal tap water, I didn't actually perform a temperature measurement). I turned the kettle on at $t=0$, and it took $6$ minutes until the kettle switched itself off. Attached are the graph of the recording, a spectrogram (log scale) and an image of the kettle:

Kettle noise vs time

Spectrogram

The electric kettle

(Due to the high sampling frequency, this graph shows mainly the envelope of the audio, but this is what I'm interested in. you can notice on the graph the sound of the initial and final "clicks" of the switch).

Looking at the graph, the pattern is indeed very visible. The amplitude increases at a steady rate from $t=30\ \mathrm s$ to $t=90\ \mathrm s$, then it increases at a bigger rate and flattens at around $t=130\ \mathrm s$, it starts to decrease at $t=210\ \mathrm s$, and at $t=290\ \mathrm s$ (which is when it seemed to me that the water started to boil) increases again to a flat value until the end.

What may be the reason for this pattern?

(If needed, I can provide more info about the experimental setup and more data visualizations)


EDIT$1$: Apparently a similar question has been asked already. But I still wonder about the various phases in the boiling process, which are not mentioned in the other question.

$\endgroup$
9
  • $\begingroup$ At what $t$ did the water start to boil? $\endgroup$
    – valerio
    Commented Dec 19, 2017 at 8:56
  • 1
    $\begingroup$ A spectrogram would be quite interesting, particularly if you already have it. I'm perpetually amazed by electric kettles' ability to provide auditory insight into how much time has elapsed / remains until boiling (down to maybe a 5% precision?) but a lot of that information is in the timbre (bubbliness? i.e. variations on the order of 0.5s or so) and not just the loudness. $\endgroup$ Commented Dec 19, 2017 at 8:57
  • $\begingroup$ @valerio92 I started hearing bubbly noise at about $290\text{sec}$ (I added this the question details now) $\endgroup$
    – Lior
    Commented Dec 19, 2017 at 9:07
  • $\begingroup$ @EmilioPisanty I added the spectrogram $\endgroup$
    – Lior
    Commented Dec 19, 2017 at 9:35
  • 1
    $\begingroup$ this can be showed like a demonstration to kids how to be scientific and how to perform an experiment in general, nice work $\endgroup$ Commented Dec 19, 2017 at 10:28

3 Answers 3

21
$\begingroup$

Here is the answer. Background: In the bottom surface of the kettle are many microscopically tiny pores, cracks and crevices. many of these retain extremely minute amounts of air after the kettle is filled with water. these air-charged pores will serve as nucleation sites, at which the boiling process will first be triggered.

as the water heats up, you will first notice air bubbles growing at the locations of the pores. this is because air dissolved in water is less soluble in hot water than cold, and the air already in the pores furnishes pre-existing sites at which the air can readily come out of solution. (As the water grows hotter, some of these bubbles will break free from the bottom of the kettle and float up to the surface, only to be replaced by fresh bubble growth at the vacated pores.) no sound is produced during this process.

Now note that although some convective heat transfer is occurring in the kettle, the bottom surface is where the heater element is and at this stage, the water next to it will be hotter than the rest of the bulk, and that this condition is actually assisted by the presence of the bubbles, which tend to insulate the bulk from the water closest to the kettle bottom.

Meanwhile, the air in the crevices is becoming enriched with water vapor at the same time that the temperature of the water is climbing, and eventually the air exsolvation process goes to completion and the pores are now charged with mostly water vapor and a little air, and most of the stuck air bubbles have detached and floated away.

each of the vapor-filled pores can be modeled as a crevice with an opening that contains a meniscus whose outward curvature, and hence its internal pressure, is given by the young-laplace equation. that pressure is balanced by the vapor pressure and as the surface grows still hotter, there comes a point where the water in the vicinity of that meniscus elects to vaporize and the meniscus suddenly everts from the mouth of the pore. because its radius of curvature decreases as its volume increases, the internal pressure required to inflate the bubble goes down as it grows, and a tiny vapor explosion occurs: the bubble undergoes very sudden growth, and it gives off a sound wave which propagates into the bulk of the water in the kettle.

That growth comes to a sudden halt once the bubble becomes big enough to protrude out of the hot environment next to the kettle bottom and contact the slightly cooler water above. the bubble is then suddenly quenched, and suddenly collapses. as the retreating meniscus collides with the kettle surface, it propagates a sound wave into the kettle bottom. almost immediately, this process repeats itself.

all across the kettle bottom, this mechanism of micro-explosions and cavitation collapses is occurring at each of the "activated" pores (those that are charged with vapor/air mixture and have menisci of appropriate radii) and the sounds thus produced blend into a hissing roar that you can hear. as more and more pores become active, the roar gets louder and very vigorous stirring of the water right next to the kettle bottom occurs. this mixes the hot water next to the bottom with the cooler water from above and soon the water far from the kettle bottom becomes just as hot as that near the bottom, and the boiling bubbles are no longer quenched by their own growth. the roar then diminishes.

Now what happens is that the boiling bubbles begin instead to detach and grow to macroscopic size, quickly bursting upward and away from the kettle bottom and the nature of the sound being produced shifts from the hissing roar of the microscopic vapor explosions to the familiar bubbledy-bubble noise, which grows in volume until it is the dominant noise you hear.

This mechanism accounts for the initial quiet phase, the gradual roar-and-hiss noise buildup, the brief minimum as the boiling mechanism switches modes, and the second bubbling noise growth phase that you observed.

$\endgroup$
1
  • $\begingroup$ It is interesting to compare the spectrogram to the estimate of Minnaert resonance at en.wikipedia.org/wiki/Minnaert_resonance - if we assume a 500 Hz frequency of the small bubbles that gives a radius of 6.52 mm. A bit large, but presumably these bubbles are not free and might be well modelled as "half bubbles". $\endgroup$ Commented Dec 19, 2017 at 10:13
1
$\begingroup$

My idea: Initially the water is cool and silent as we expected it. The water is heated by heat conduction based on the direct contact with the warmer surface. After a while a thin layer of water at the bottom reaches the boiling point and small vapour bubbles are formed generating the noise you measured. As time goes, more and more bubbles are generated, however, they cannot maintain their shape because the water in the higher areas are still cold, so they collapse immediately after they are released from the bottom. This process is getting more and more intensive until the bubbles in the bottom manage to form a more of less continuous layer. In this point the heat transfer by radiation becomes more significant resulting in a lower noise, since the water is not in direct contact with the hot plate. The slight increment of noise right before the kettle turns off is generated by the rapid boiling of the water with emerging bubbles that reach the surface.

$\endgroup$
-1
$\begingroup$

As a chef, not a mathematician I imagine you are confusing 2 audable frequencies, the first being the increasing excited state of the water heating and hence the increasing decibel and higher pitch, at least until it is out of your audible perception, the sudden decrease, the second series of sound is the water beginning to boil and its interaction with the surrounding material. The actual cyclical variance from the electricity could also play with the acoustics, and give a "spooky" effect, like the occilating hums from most appliances, and household electronics. I personally hate the duo of my freezers ice maker with the kitchen's fluorescent lighting. So my guess is the first part of the graph with more sensitive equipment would show a continuing upward trend in both pitch and decibel.

$\endgroup$
1
  • $\begingroup$ The equipment is already plenty sensitive enough: at 44.1KHz sampling rate you can record sounds up to 22KHz. His graph only shows the first 6KHz, presumably because there is not much going on above that. If the frequency sweeped past that point we'd certainly see it on the graph presented. $\endgroup$
    – Fax
    Commented Sep 13, 2019 at 10:08

Not the answer you're looking for? Browse other questions tagged or ask your own question.