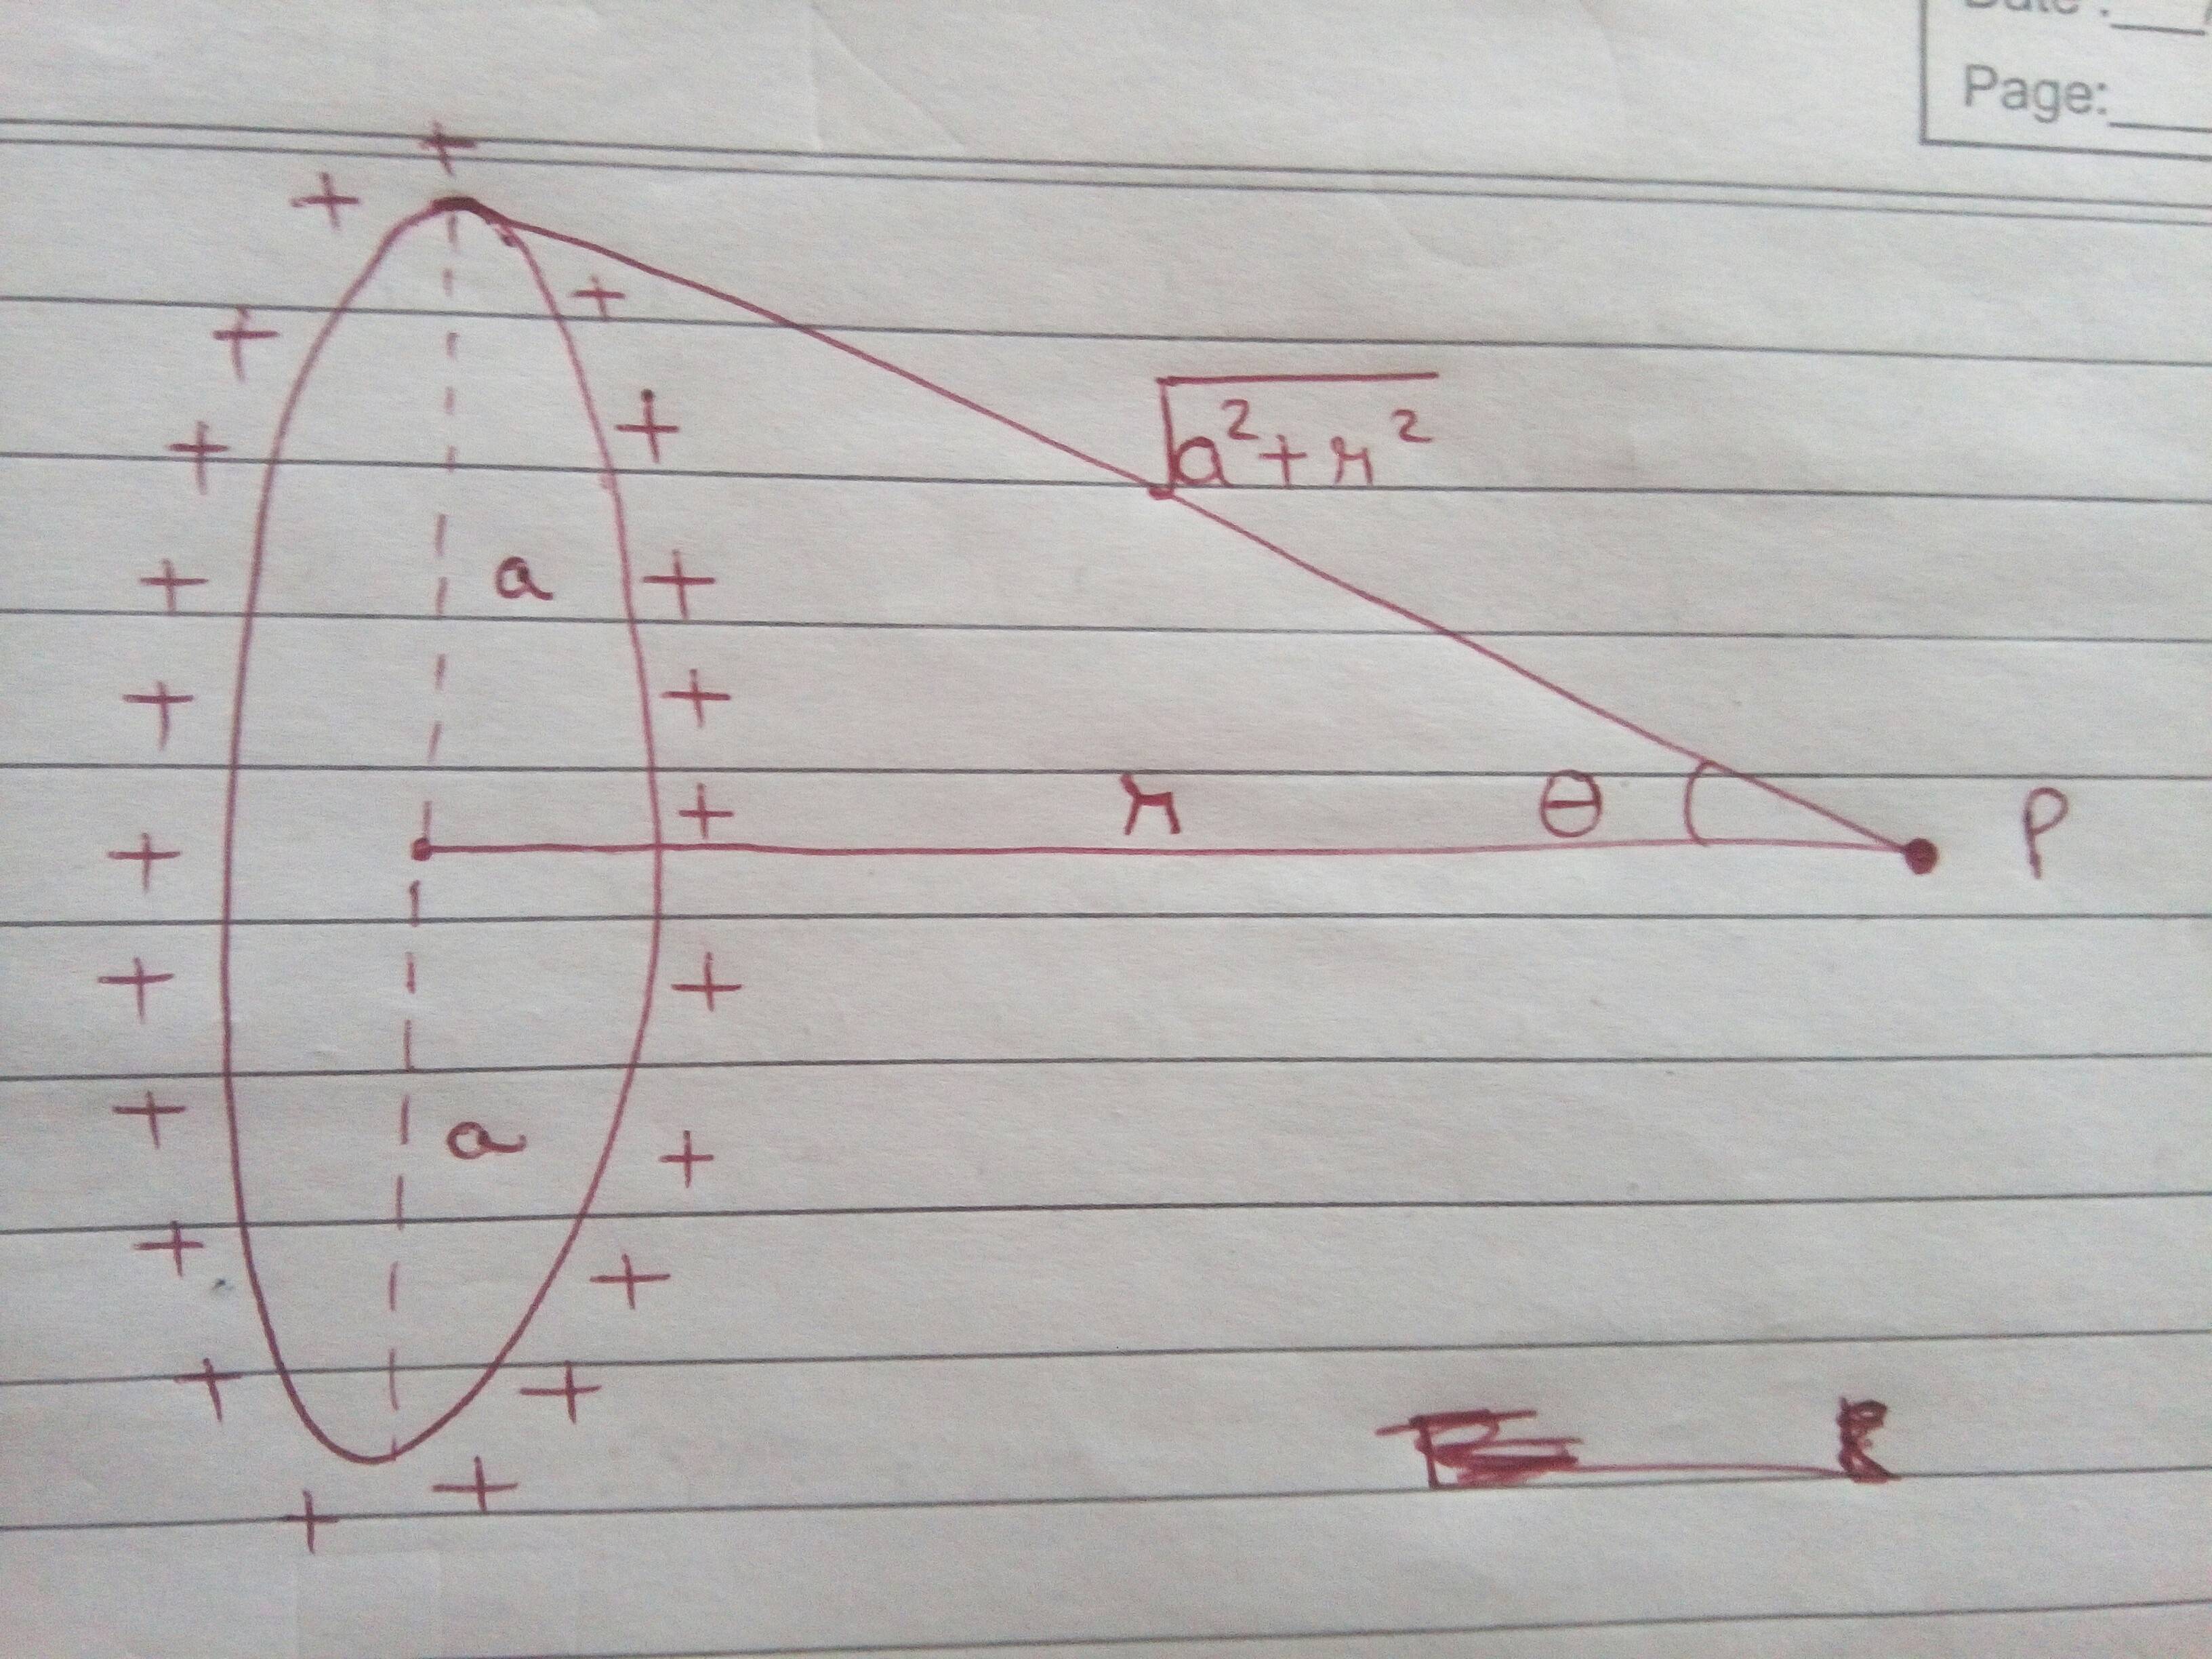
Let's first find the expression for the electric field due to the ring.
Note that the differential element $dE$ (of the electric field $E$) at P on the axis of the ring is given by-
$$
d\vec{E} = \dfrac{1}{4\pi \epsilon_0} \dfrac{dq}{r^2 + a^2}
$$
Recall that the electric field is a vector and hence we have to consider its components. It is trivial that the perpendicular component does not contribute to the net electric field (by symmetry), and hence only the horizontal component contributes.
Hence, $
dE_{net} = dE_x = \dfrac{1}{4\pi \epsilon_0} \dfrac{dq \cos \theta }{r^2 + a^2}
$
And from the diagram, $\cos \theta = \dfrac{r}{\sqrt{r^2 + a^2}}$.
Therefore, $E_{net} = \int dE_{net} = \dfrac{1}{4\pi \epsilon_0} \dfrac{r}{{(r^2 + a^2)}^{\frac{3}{2}}} \int dq = \dfrac{1}{4\pi \epsilon_0} \dfrac{qr}{{(r^2 + a^2)}^{\frac{3}{2}}}$
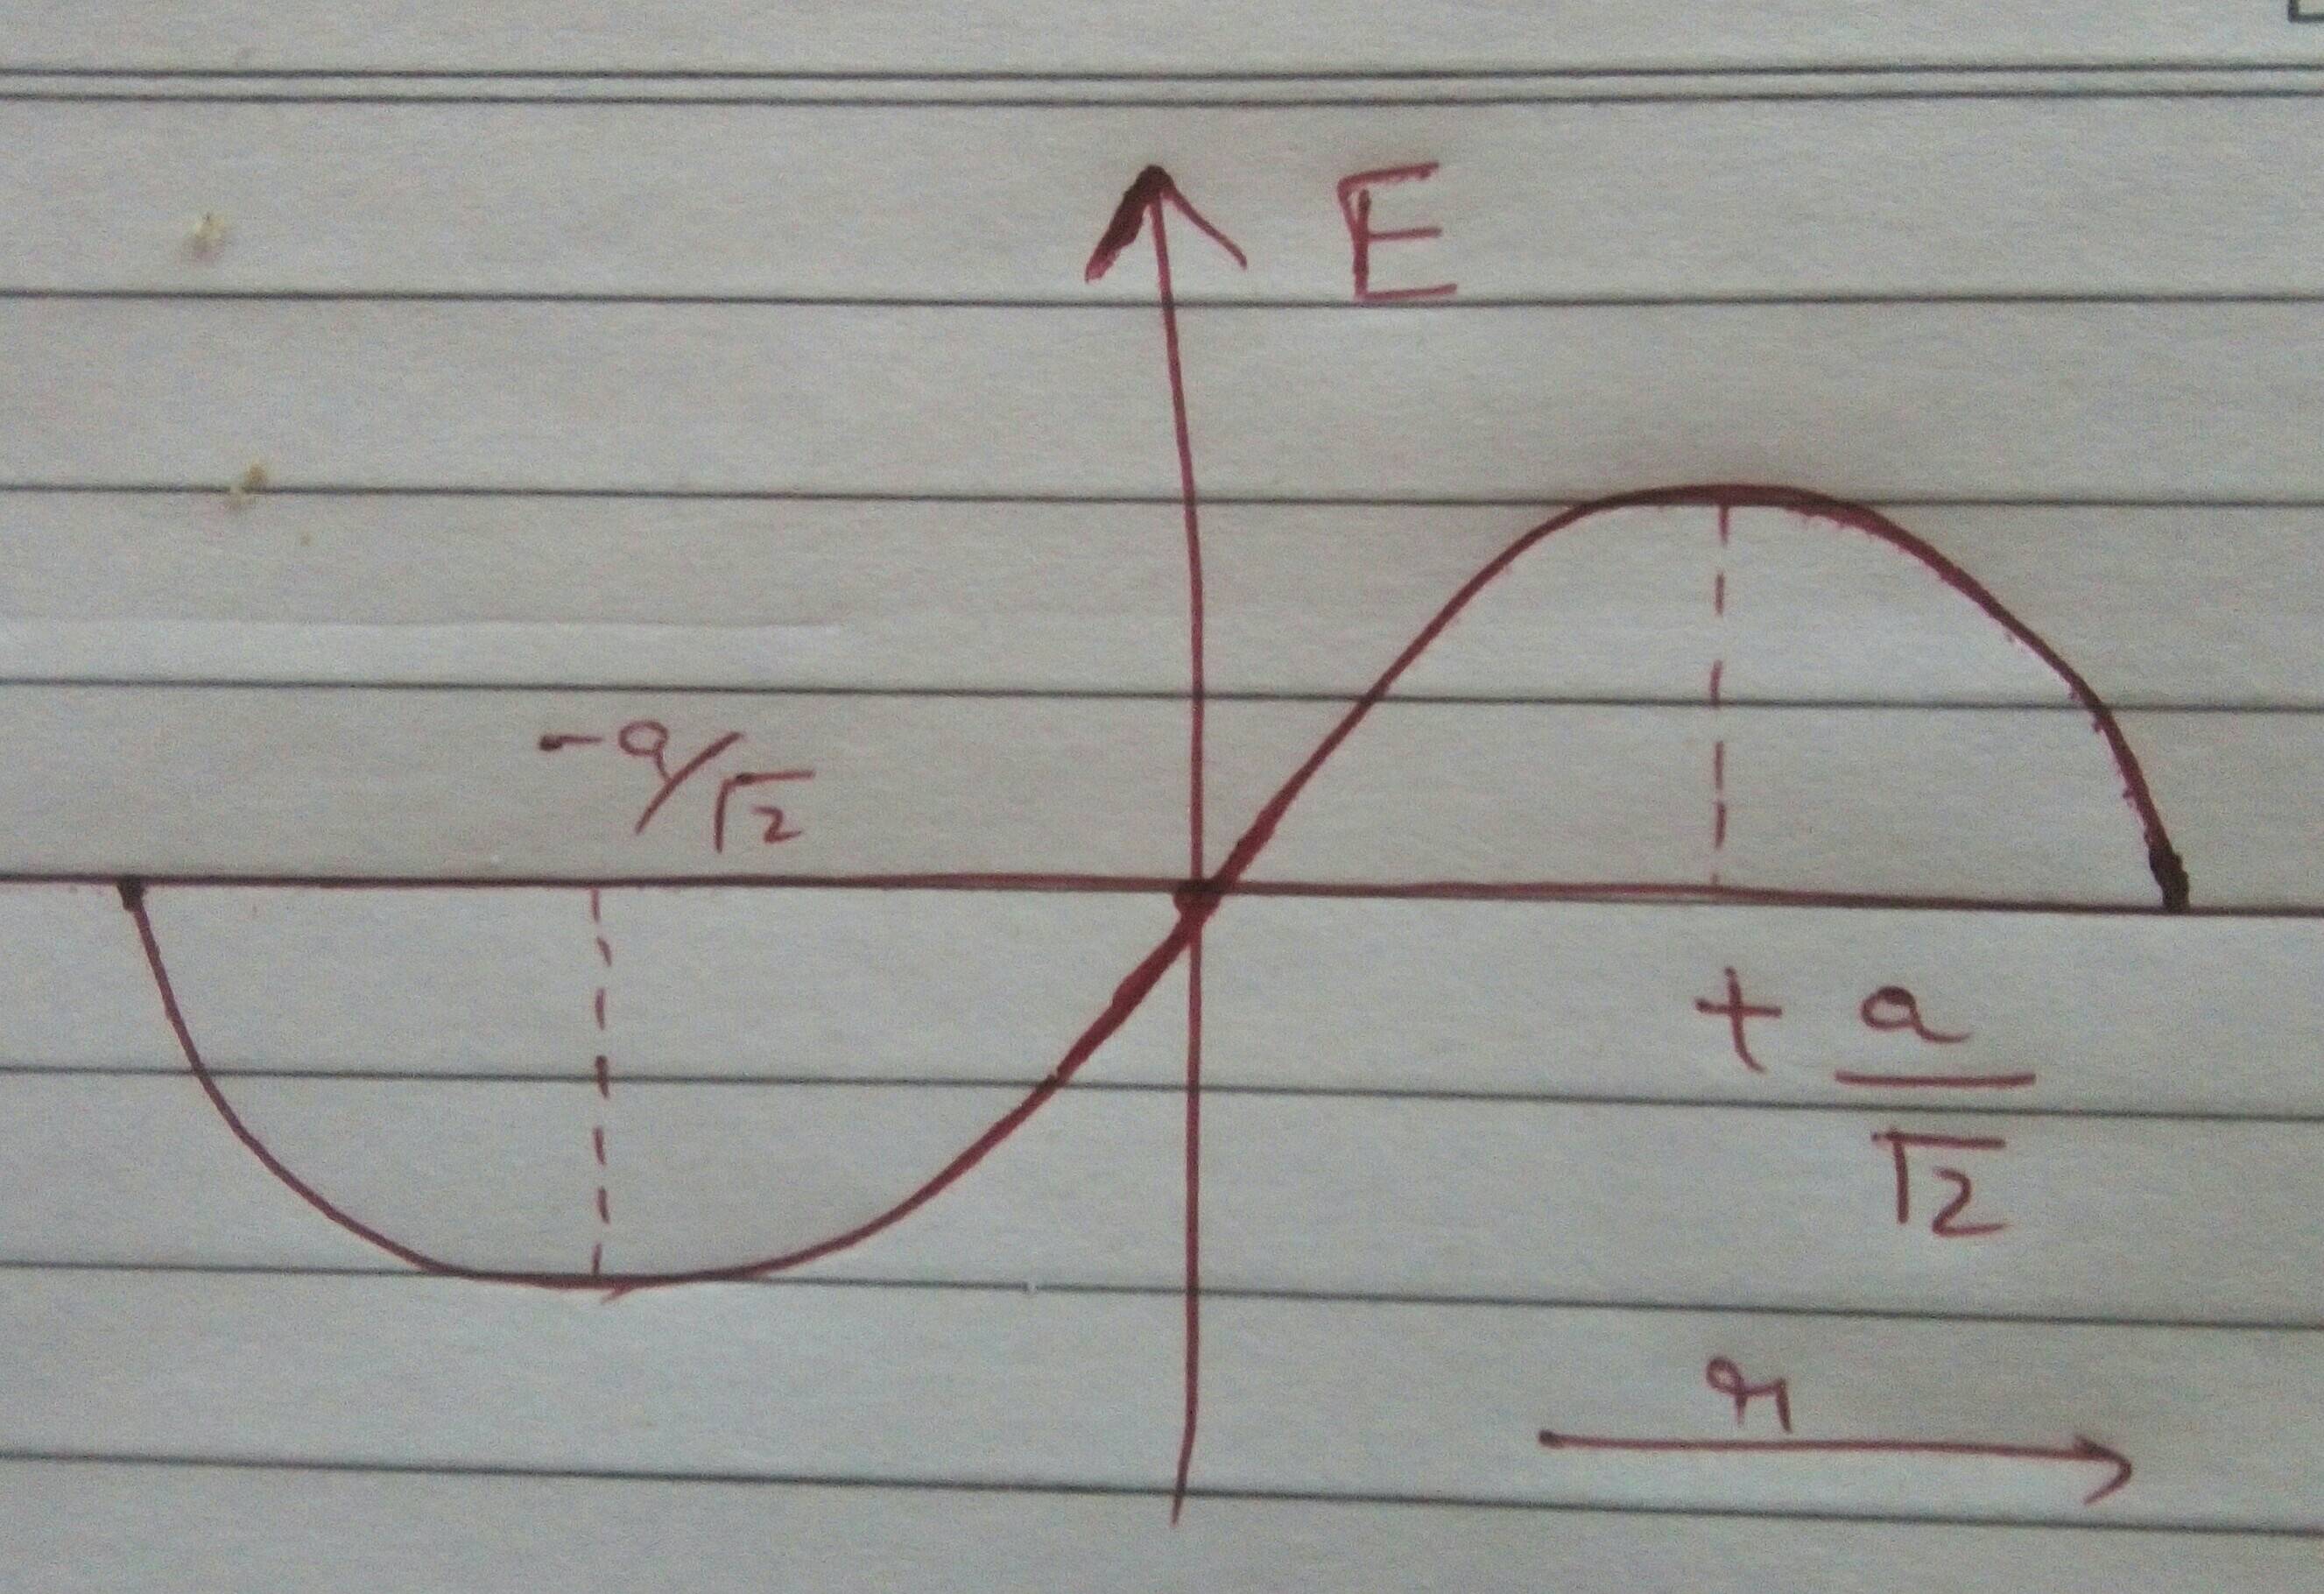
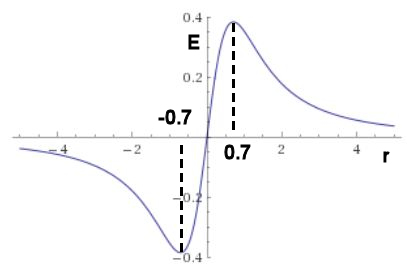
The maxima and minima of $E_{net}$ can be obtained by setting $\dfrac{dE_{net}}{dx} = 0$ and which occur at $\dfrac{a}{\sqrt{2}},\dfrac{-a}{\sqrt{2}}$ respectively, and which tells us that the electric field is highest/maximum at $\dfrac{a}{\sqrt{2}}$ and minimum at $\dfrac{-a}{\sqrt{2}}$, also seen from the graph. Other than that, the graph just represents the variation of electric field due to a uniformly charged ring as a function of the distance $r$ from the center of the ring on its axis.

 Can anyone please explain me how to read this graph, or what does this graph tells us?
