0
$\begingroup$

I know that resistance is inversely proportional to the cross sectional area, but I need to explain why with the following data:

Wire    │ Length (m) │ Diameter (mm) │ Cross Section (mm) | Resistance (Ω)
────────┼────────────┼───────────────┼────────────────────┼───────────────
Wire 1  │ 1m         │ 0.19mm        │ 0.02835 mm         │ 0.59 Ω
────────┼────────────┼───────────────┼────────────────────┼───────────────
Wire 2  │ 1m         │ 0.31mm        │ 0.07548 mm         │ 0.22 Ω

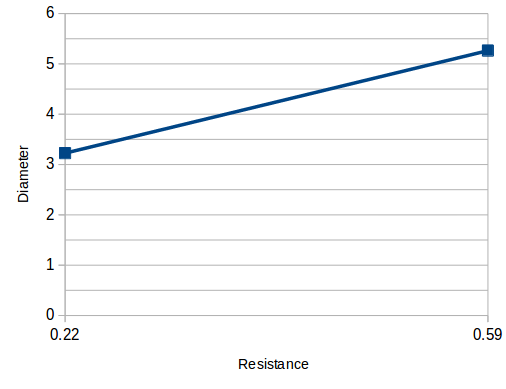
I made a graph showing the inverse of the diameter compared to the resistance:

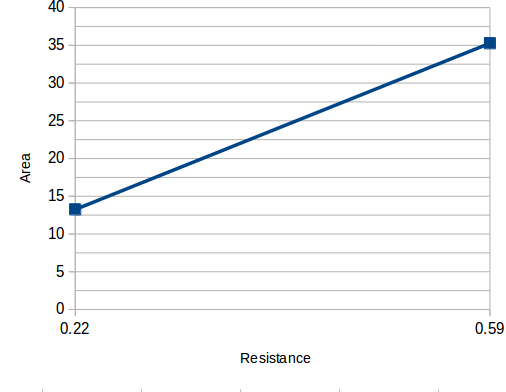
And one for the inverse of the cross sectional area:

But I don't know what to do now. If diameter was inversely proportional, then a wire with the average of the two diameters (0.25 mm) would also have an average of the resistances (0.405) but I can't disprove this (even though I know it isn't) because they haven't given us a third data point.

How can I use the data above to show that resistance is inversely proportional to cross sectional area?


For reference, here is a photo of the question I'm working from.

$\endgroup$
7
  • $\begingroup$ Your plots seem to be wrong. Your horizontal axis seem to be the resistances, but with the higher value to the left and the lower to the right, so the direction of that axis is wrong. Your vertical axis (top plot) is inverse diameter, not resistance. $\endgroup$
    – Gert
    Commented Aug 31, 2015 at 16:44
  • $\begingroup$ And how did you get the "cross section" column? If I calculate $\pi\left(d/2\right)^2$ I don't get anything like the same numbers you did. $\endgroup$
    – The Photon
    Commented Aug 31, 2015 at 16:47
  • 2
    $\begingroup$ Also, basing a relationship off two data points can be dangerous. $\endgroup$
    – Kyle Kanos
    Commented Aug 31, 2015 at 16:57
  • $\begingroup$ @Gert Thanks for pointing it out, I labelled them the wrong way round, and had the smaller in the column after the larger. $\endgroup$
    – Tim
    Commented Aug 31, 2015 at 17:17
  • $\begingroup$ @ThePhoton I managed to square the Diameter not the radius... Oops. $\endgroup$
    – Tim
    Commented Aug 31, 2015 at 17:17

1 Answer 1

1
$\begingroup$

As @KyleKanos says, establishing a relationship with only two data points is dangerous.

However, with that warning, if you want to test a relationship between quantities which you think might have some proportionality, you can take ratios of like quantities. Then test whether there is a relationship between various powers of the ratios.

For example, if you compare the orbital periods ($T_1$ and $T_2$) of two planets around a common star with the semi-major axes of their orbits ($a_1$ and $a_2$) you would calculate the ratios $$\frac{T_1}{T_2}\text{ and } \frac{a_1}{a_2}$$

then see if the ratios are equal, one if the inverse of the other, one is the square or inverse square of the other, the square of one is the cube of the other, etc.

If you have several data points you could construct a log-log plot. A straight line on a log-log plot shows some type of proportionality.

In your case, compare the ratio of the resistances with the ratio of the area.

$\endgroup$

Your Answer

By clicking “Post Your Answer”, you agree to our terms of service and acknowledge you have read our privacy policy.

Not the answer you're looking for? Browse other questions tagged or ask your own question.