2
$\begingroup$

I understand how to solve this problem, but I am unsure how to generate an equation for the graph (below). My current attempt involves using the mass provided along with the derivative of the line (acceleration) to calculate the force (Newtons Second Law). enter image description here

Usually, point slope form would work. However, it's a curve, so the only thing point-slope can do is give me an approximation. I feel like I am missing something. Maybe the approximation is the right way to go?

$\endgroup$
2
  • $\begingroup$ I agree with you, this question is not well formulated. I would try to approximate the slope as best as you can (perhaps using the segment between speeds 45 and 40). Might I ask where did you get this question? (I just want to know who to blame!) $\endgroup$
    – user65081
    Commented Oct 28, 2014 at 4:35
  • $\begingroup$ Okay, so a generalization is the best approach based on the question $\endgroup$
    – steveclark
    Commented Oct 28, 2014 at 5:51

2 Answers 2

1
$\begingroup$

How you approach this depends on the time and resources you have available to you.

If a problem like this cropped up as part of a scientist's work the best approach would be to try and understand the underlying physics. You would develop a mathematical model for the system then fit the data to a function derived from that model. In this case the model would be complicated as you have quadratic aerodynamic drag and mechanical drag that is probably (but not necessarily) linear in the velocity.

The next best option is to just choose some function based on how well you think it would fit rather than because it has any physical significance. In this case 5 minutes with copy of Excel produced a fit:
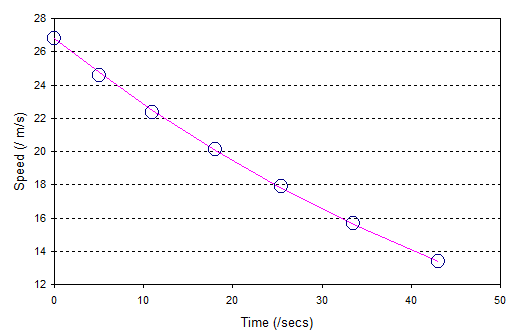
Fit

with the pink line showing the fitted function:

$$ v = v_0 e^{-0.0162 t} $$

where $v_0$ is the speed at $t = 0$, and the speed has been converted to metres per second. You can differentiate the fitted function to get a fitted acceleration and therefore the force. NB I had to read the points off your graph so there will be an additional source of error due to this.

If the question cropped up in an exam I'd guess the intention is that you just measure the tangent by eye using a ruler.

$\endgroup$
1
  • $\begingroup$ Exp fits quite ok, but is unfortunately the solution for $B=0$ (see next). Solving $\dot v+A v+ B v^2=0$ you actually get $v(t)=C/(A \exp(A t)-D)$ with $B=A D/C$. Note that this continues with the assumption that the wind friction goes quadratic with speed while rolling friction is assumed to be linear. So if you fit this, you get $A$ and $B$ and, therefore, directly the forces. I guess, however, the idea was to make it graphically like @RossMillikan suggested. (Now I am just a little bit puzzled by the divergence of the system at negative times, assuming $D>0$. What does that imply?) $\endgroup$ Commented Oct 29, 2014 at 8:26
0
$\begingroup$

At each point you have $F=ma$. The instantaneous acceleration is the slope of the speed-time curve. It looks like acceleration may be a linear function of time here. You could pick three points and calculate the acceleration and speed as a function of time and see if they match the curve. It will be hard, as errors will depend on the error of the speed from your model. The other choice is to use a ruler to approximate the tangent to the curve, get the slope, consider that the acceleration, and again use $F=ma$

$\endgroup$
1
  • $\begingroup$ Yeah, that's exactly what I was thinking. The three point model is a good start though. Not having the equation has to make it an approximation though. $\endgroup$
    – steveclark
    Commented Oct 28, 2014 at 4:44

Your Answer

By clicking “Post Your Answer”, you agree to our terms of service and acknowledge you have read our privacy policy.

Not the answer you're looking for? Browse other questions tagged or ask your own question.